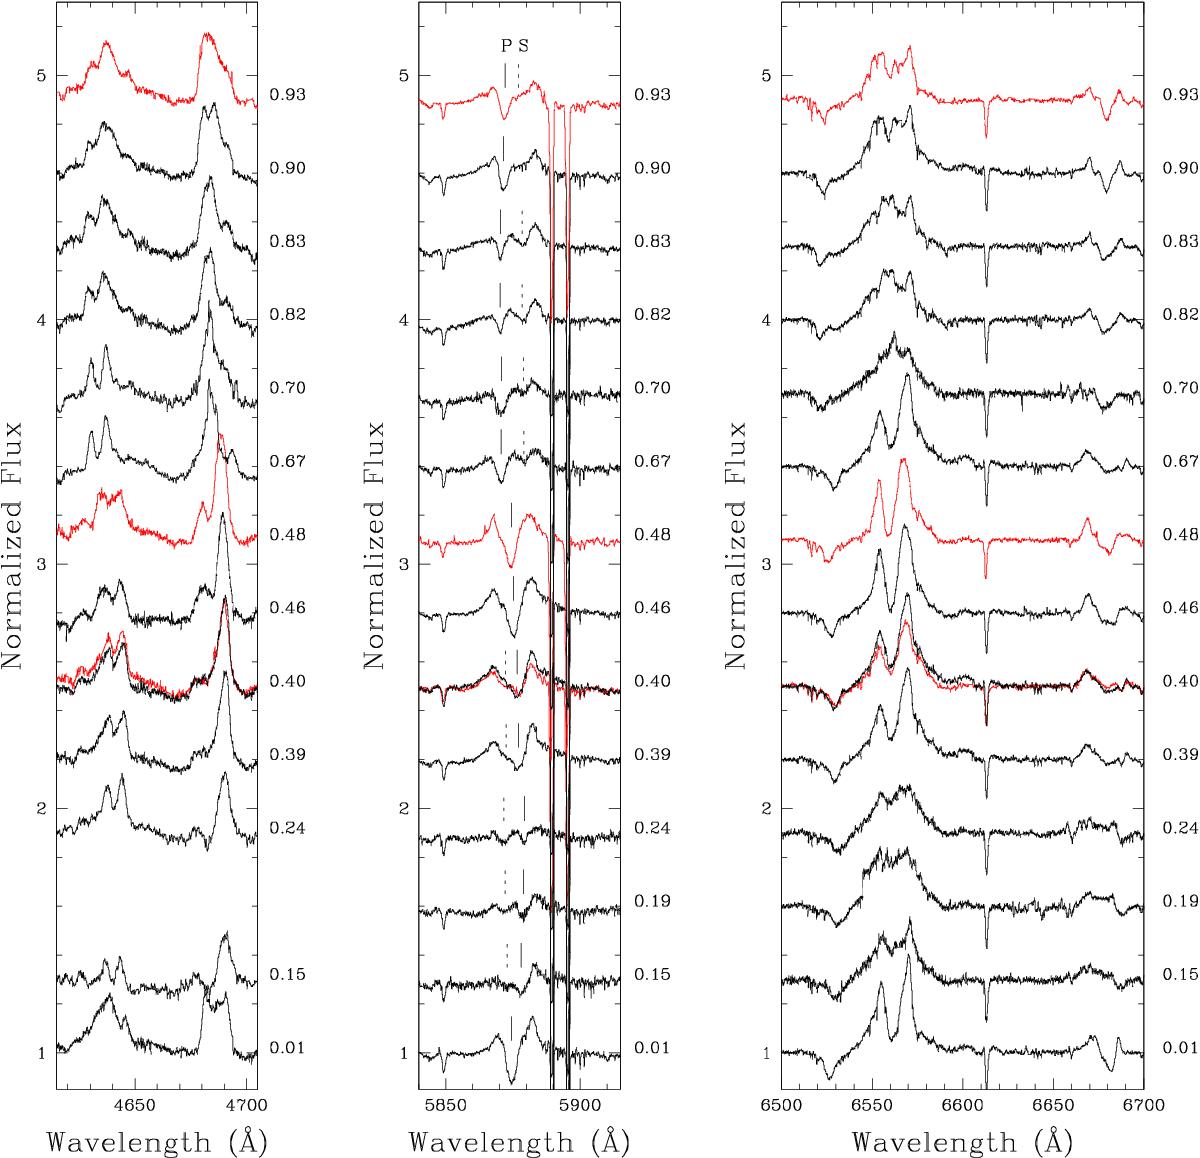
Fig. 4

Line profile variations of some important emission lines in the optical spectrum of LSS 3074. N iii λλ 4634-4641 and He ii λ 4686 are shown in the left panel; He i λ 5876 is represented in the central panel; and Hα is indicated in the right panel. The orbital phases computed according to the ephemerides in Table 4 are given on the right of each panel. The red spectra correspond to the EMMI observations. The vertical solid (resp. dotted) lines in the middle panel represent the position of the primary (resp. secondary) He i λ 5876 line for the given observation.
Current usage metrics show cumulative count of Article Views (full-text article views including HTML views, PDF and ePub downloads, according to the available data) and Abstracts Views on Vision4Press platform.
Data correspond to usage on the plateform after 2015. The current usage metrics is available 48-96 hours after online publication and is updated daily on week days.
Initial download of the metrics may take a while.


