Fig. C.1
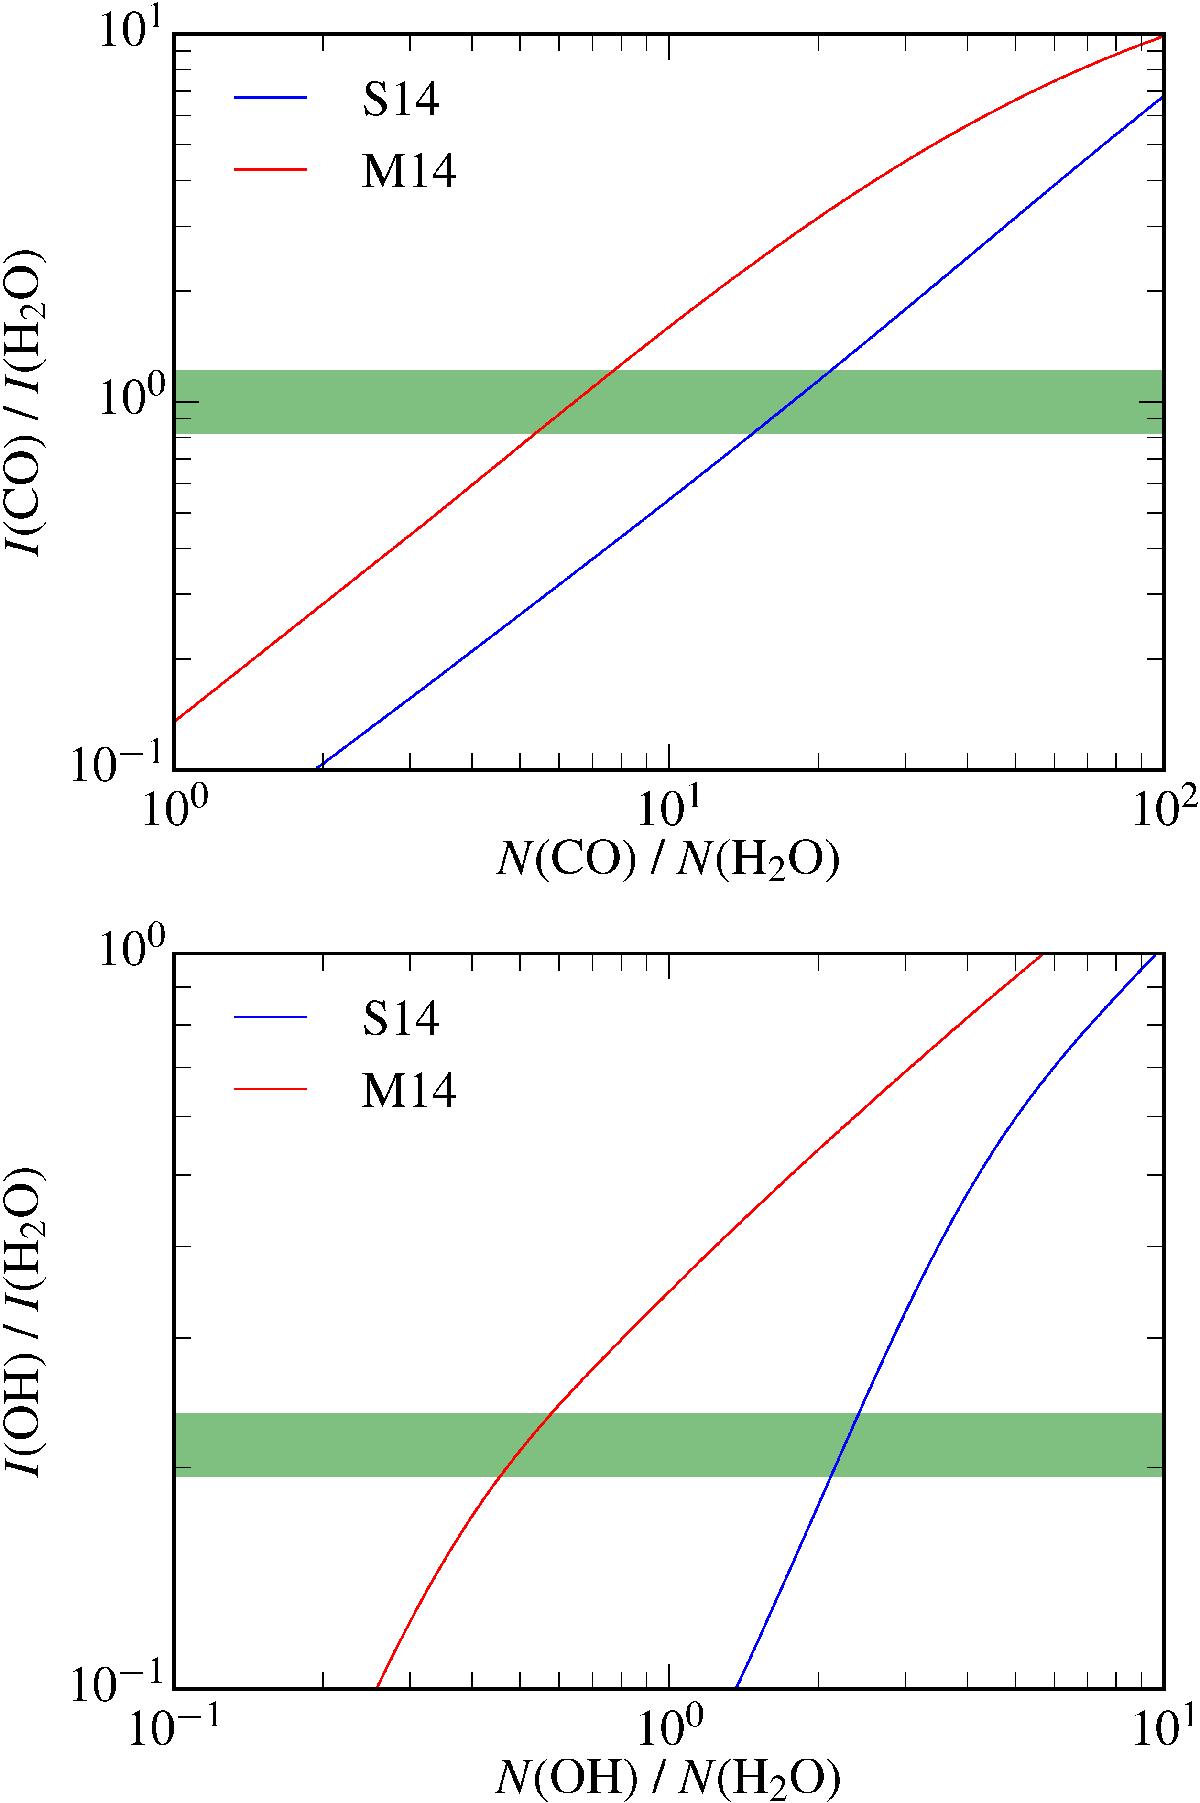
Radex model predictions for the CO/H2O (top), and OH/H2O (bottom) column density ratios inferred from the conditions in Table 3, shown in red and blue, respectively. The observed line intensity ratios are plotted in green, where the OH/H2O ratio is an upper limit, and all ratios are against the H2O 111–000 HV intensity of 4.7 K km s-1.
Current usage metrics show cumulative count of Article Views (full-text article views including HTML views, PDF and ePub downloads, according to the available data) and Abstracts Views on Vision4Press platform.
Data correspond to usage on the plateform after 2015. The current usage metrics is available 48-96 hours after online publication and is updated daily on week days.
Initial download of the metrics may take a while.