Fig. 1
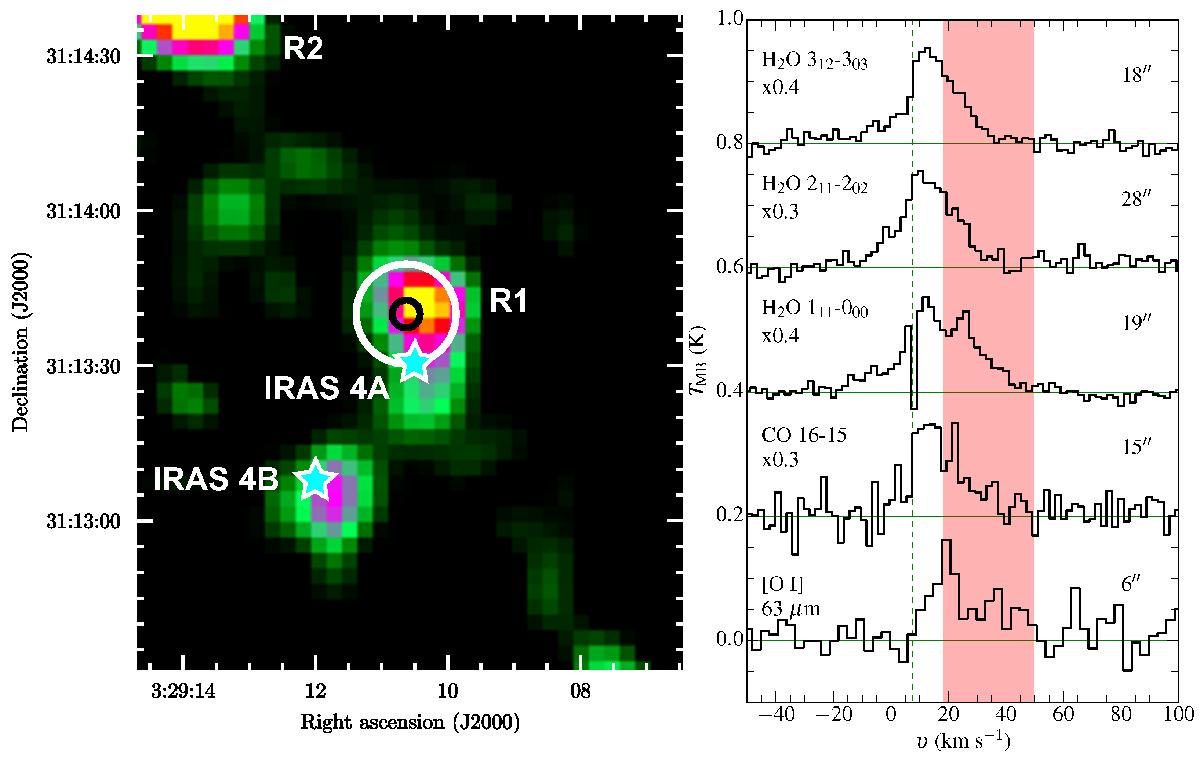
Left: [O i] 63 μm integrated intensity map of the NGC 1333-IRAS4A and 4B outflows as obtained with Herschel-PACS (Nisini et al. 2015). The R1 position is shown with black and white circles just north of the source position; the smaller circle has a diameter of 6′′, and the larger circle has a diameter of 20′′. The protostellar positions are marked with stars. Right: spectra of selected transitions observed toward the R1 position in the NGC 1333-IRAS4A outflow. The [O i] and CO 16–15 spectra are observed with SOFIA-GREAT and the three H2O spectra with Herschel-HIFI. Most spectra have been scaled by a factor as labeled. The source velocity, 7.5 km s-1, is shown with a vertical dashed line, and the the HV component from 18−50 km s-1 is highlighted in red. The beam size is shown on the right for each spectrum.
Current usage metrics show cumulative count of Article Views (full-text article views including HTML views, PDF and ePub downloads, according to the available data) and Abstracts Views on Vision4Press platform.
Data correspond to usage on the plateform after 2015. The current usage metrics is available 48-96 hours after online publication and is updated daily on week days.
Initial download of the metrics may take a while.