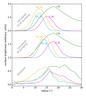
Fig. 6
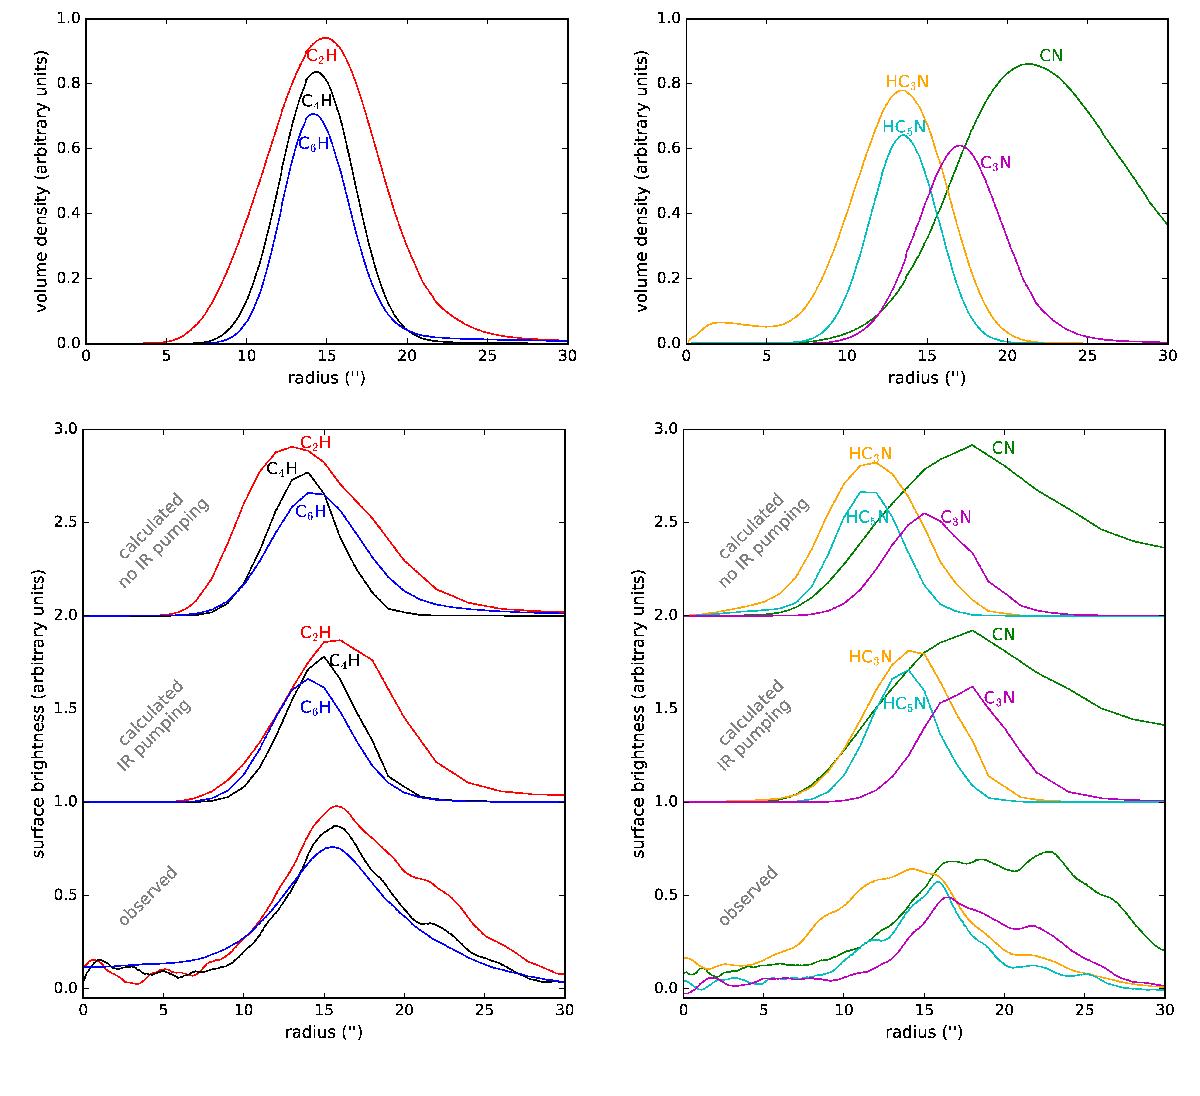
Top panels: calculated radial distributions of abundances expressed as number of particles per unit volume. Curves have been arbitrarily scaled in the y-axis for display. Bottom panels: comparison between calculated (neglecting and including infrared pumping) and observed radial distributions of the emission at velocities around VLSR = Vsys for the lines of C2H, C4H, and C6H (left), and CN, C3N, HC3N, and HC5N (right) plotted in Fig. 1. The observed brightness distributions are those previously shown in Fig. 4. Curves have been arbitrarily scaled and shifted along the y-axis for display.
Current usage metrics show cumulative count of Article Views (full-text article views including HTML views, PDF and ePub downloads, according to the available data) and Abstracts Views on Vision4Press platform.
Data correspond to usage on the plateform after 2015. The current usage metrics is available 48-96 hours after online publication and is updated daily on week days.
Initial download of the metrics may take a while.