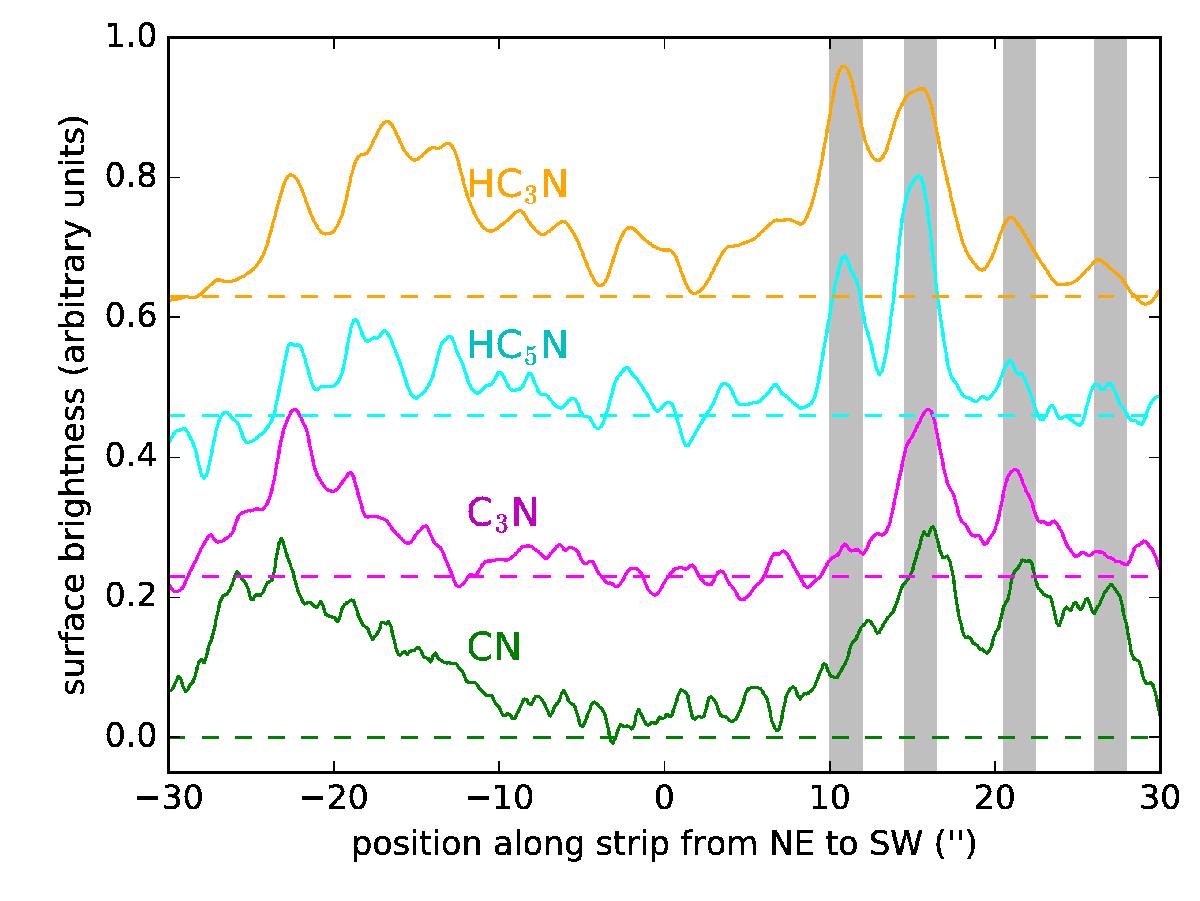
Fig. 3

Brightness distributions of the cyanides HC3N, HC5N, C3N, and CN along a strip intersecting the star at PA = 45°. Curves are extracted from the maps shown in Fig. 1 and have been arbitrarily scaled and shifted in the y-axis for display. Horizontal dashed lines indicate the zero of intensity. Gray vertical shadows indicate the positions of brightness maxima in the SW direction from the star, at 11′′, 15.′′5, 21.′′5, and 27′′.
Current usage metrics show cumulative count of Article Views (full-text article views including HTML views, PDF and ePub downloads, according to the available data) and Abstracts Views on Vision4Press platform.
Data correspond to usage on the plateform after 2015. The current usage metrics is available 48-96 hours after online publication and is updated daily on week days.
Initial download of the metrics may take a while.


