Fig. 3
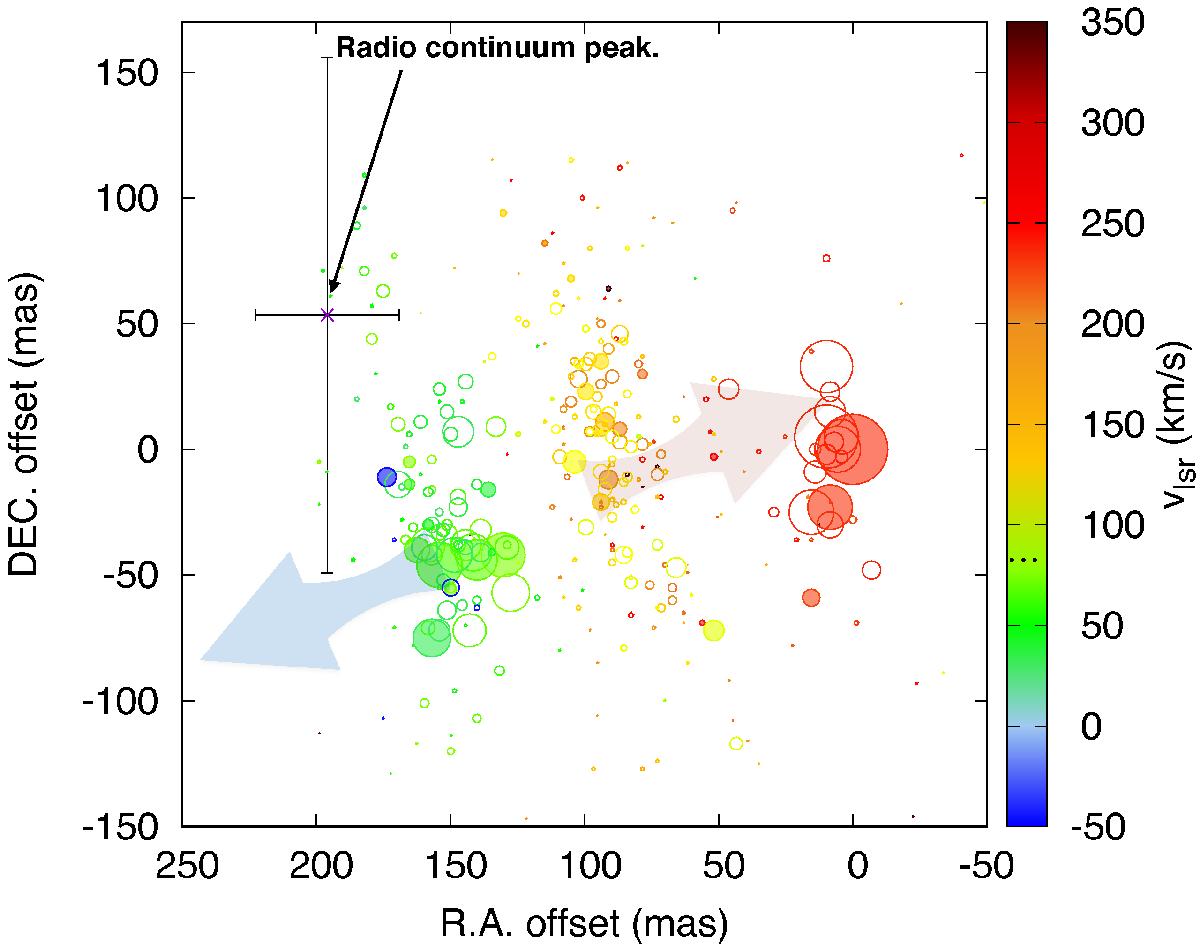
Spatial distribution of the radio continuum and the spectral features of H2O maser emission detected at 22 GHz with ATCA. The radio continuum and the H2O maser observations were carried out simultaneously in 2013. The star with error bars shows the relative position of the peak of the radio continuum detected at 22 GHz with respect to the brightest H2O maser feature. The size of each circle scales linearly with the intensity of emission measured in each channel related to H2O spectral features. Each filled circle represents the brightest channel of each spectral figure in Fig. 2. The dots in the color bar indicate the velocity of the stellar source v⋆,lsr. The blue and red arrows indicate a possible orientation (projected on the plane of the sky) of the axis defined by the high-velocity outflow traced by the H2O maser emission.
Current usage metrics show cumulative count of Article Views (full-text article views including HTML views, PDF and ePub downloads, according to the available data) and Abstracts Views on Vision4Press platform.
Data correspond to usage on the plateform after 2015. The current usage metrics is available 48-96 hours after online publication and is updated daily on week days.
Initial download of the metrics may take a while.