Fig. 6
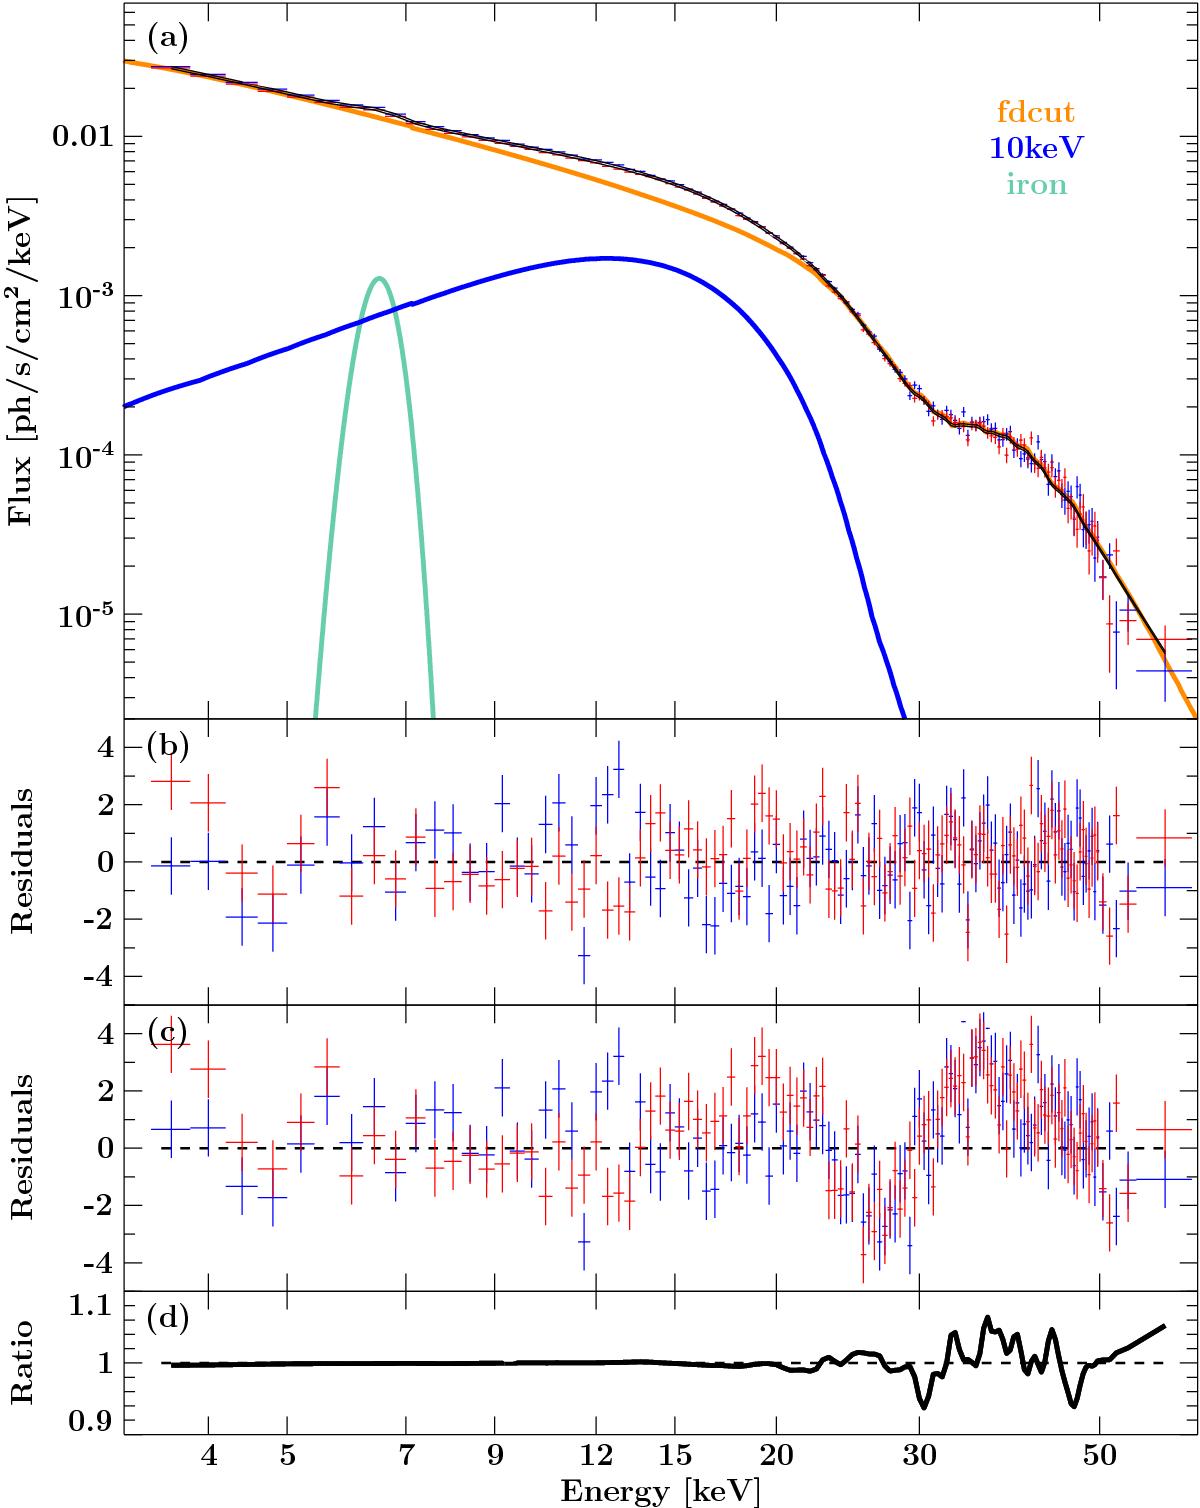
a) Unfolded spectrum, best-fit model, and individual continuum components for an observation (ObsID 80002016002) of Cep X-4. The data and residuals from NuSTAR FPMA and FPMB are shown in red and blue, respectively. b) Residuals to the best-fit model. c) Residuals to the best-fit model with a Gaussian absorption line centered at the cyclotron line position found by the best-fit model. Only the width and depth of the line have been fitted. d) Ratio between the physical and the empirical model. In the empirical model, all line parameters were allowed to vary including the centroid energy. The data have been regrouped for improved clarity.
Current usage metrics show cumulative count of Article Views (full-text article views including HTML views, PDF and ePub downloads, according to the available data) and Abstracts Views on Vision4Press platform.
Data correspond to usage on the plateform after 2015. The current usage metrics is available 48-96 hours after online publication and is updated daily on week days.
Initial download of the metrics may take a while.