Fig. 3
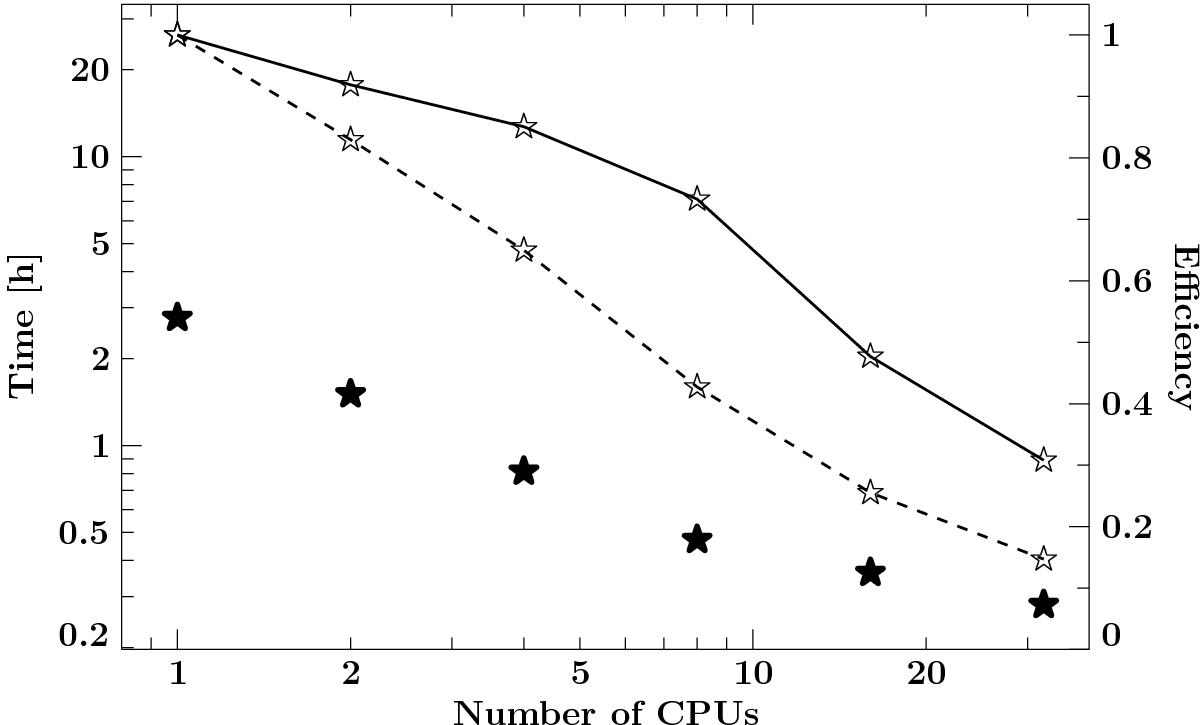
Absolute CPU time (filled symbols) on the left axis and multi-core efficiency (lines) on the right axis for the simulation of synthetic spectra. The efficiency is calculated as η = t1/ (ntn), where tn is the execution time on n CPUs. The simulation speed tests have been performed on an AMD Opteron 2.2 GHz system (dashed line) as well as on an Intel Xeon 2690 2.6 GHz system (solid line and filled symbols). The simulations have been performed for the same parameters as in Fig. 4 below, but with only 100 input photons per energy bin instead of 10 000. Absolute CPU times depend on the chosen parameter values.
Current usage metrics show cumulative count of Article Views (full-text article views including HTML views, PDF and ePub downloads, according to the available data) and Abstracts Views on Vision4Press platform.
Data correspond to usage on the plateform after 2015. The current usage metrics is available 48-96 hours after online publication and is updated daily on week days.
Initial download of the metrics may take a while.