Fig. 1
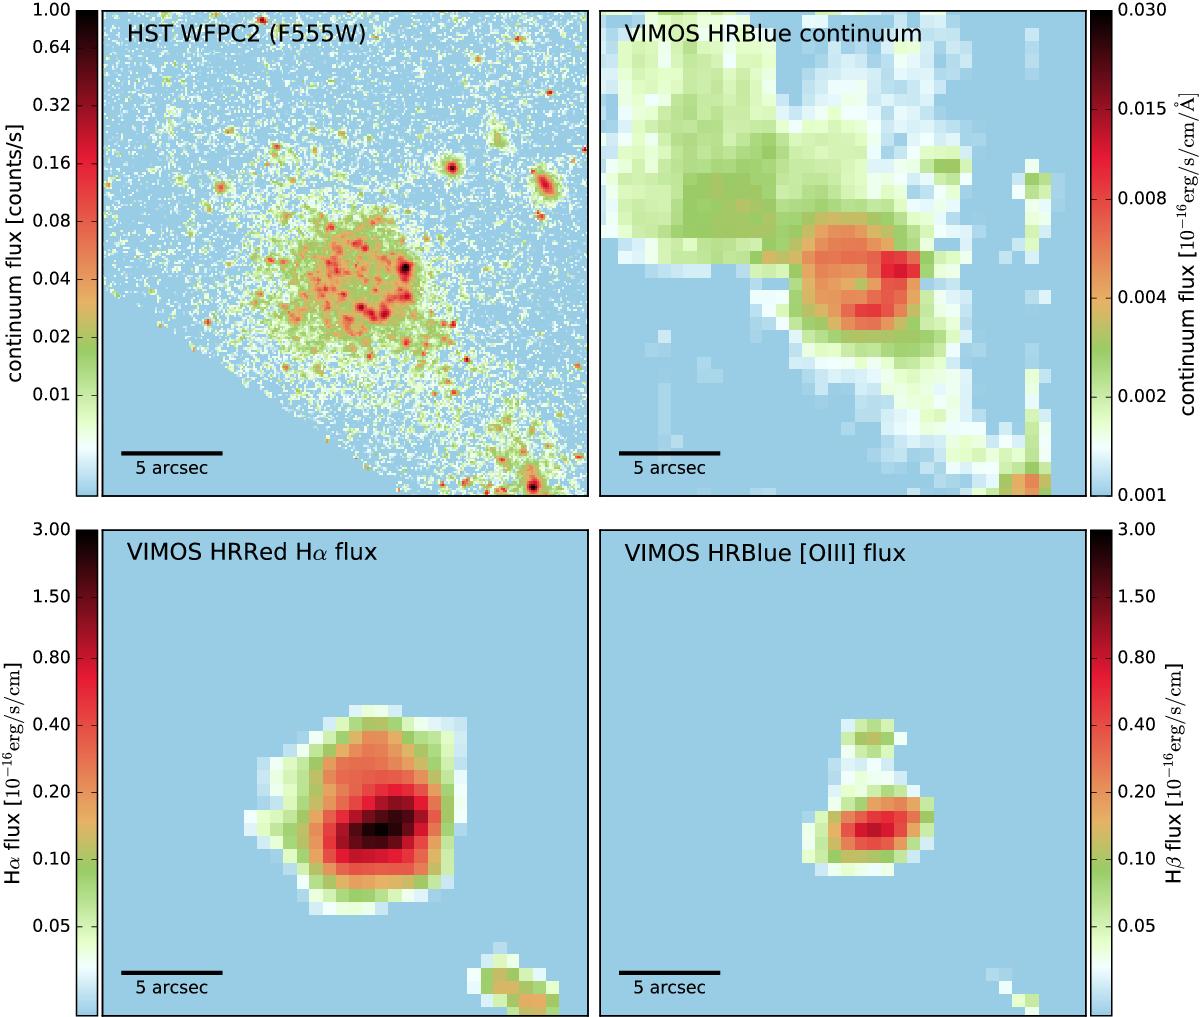
HST image and line maps of SH2. All panels have a size of 27″ × 27″ corresponding to 2.33 × 2.33 kpc2. The 5′′ scale bar corresponds to 432 pc. Upper left panel: F555W HST-WPC2 image, matching the line and continuum maps. Upper right panel: continuum map from the HRB grism spectra, using median values. Lower left panel: Hα flux map from the HRR instrument set-up. Lower right panel: map of the [Oiii]-line at 5007 Å using the HRB set-up. In all frames north is towards the top and east is left.
Current usage metrics show cumulative count of Article Views (full-text article views including HTML views, PDF and ePub downloads, according to the available data) and Abstracts Views on Vision4Press platform.
Data correspond to usage on the plateform after 2015. The current usage metrics is available 48-96 hours after online publication and is updated daily on week days.
Initial download of the metrics may take a while.