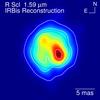
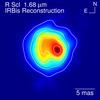
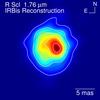
Fig. 9

Image reconstructions of R Scl based on our 2014 PIONIER data and the IRBis image reconstruction package (Hofmann et al. 2014). The three images represent the three PIONIER spectral channels with central wavelengths 1.59 μm (left), 1.68 μm (middle), and 1.76 μm (right). The images are convolved with a theoretical point spread function (PSF) using a Gaussian with FWHMλcentral/Bmax. Our estimate of the Rosseland angular diameter is indicated by the dashed black circle. Contours are drawn at levels of 0.9, 0.7, 0.5, 0.3, 0.1.
Current usage metrics show cumulative count of Article Views (full-text article views including HTML views, PDF and ePub downloads, according to the available data) and Abstracts Views on Vision4Press platform.
Data correspond to usage on the plateform after 2015. The current usage metrics is available 48-96 hours after online publication and is updated daily on week days.
Initial download of the metrics may take a while.