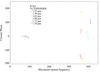
Fig. 6
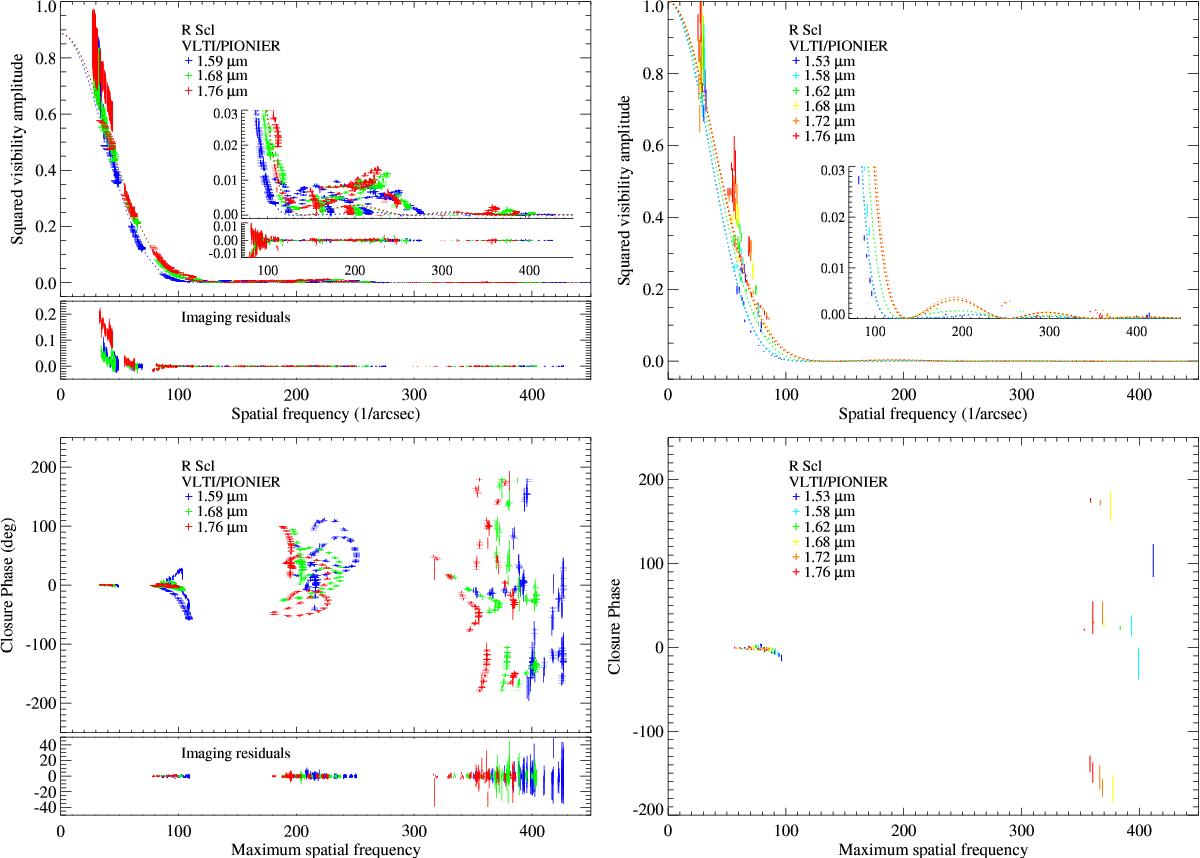
PIONIER results of R Scl as a function of spatial frequency including the squared visibility values (top) and the closure phases (bottom). The left panels show the results obtained in 2014, and the right panels the results obtained in 2015. The vertical bars indicate the symmetric error bars. The central positions of the measured values are omitted for the sake of clarity. The different colors denote the different spectral channels. The dashed lines indicate the best-fit model atmospheres. For the 2014 data, the synthetic values based on the reconstructed images are shown by horizontal bars. Here, the lower small panels provide the residuals between observations and reconstructed images.
Current usage metrics show cumulative count of Article Views (full-text article views including HTML views, PDF and ePub downloads, according to the available data) and Abstracts Views on Vision4Press platform.
Data correspond to usage on the plateform after 2015. The current usage metrics is available 48-96 hours after online publication and is updated daily on week days.
Initial download of the metrics may take a while.