Fig. 4
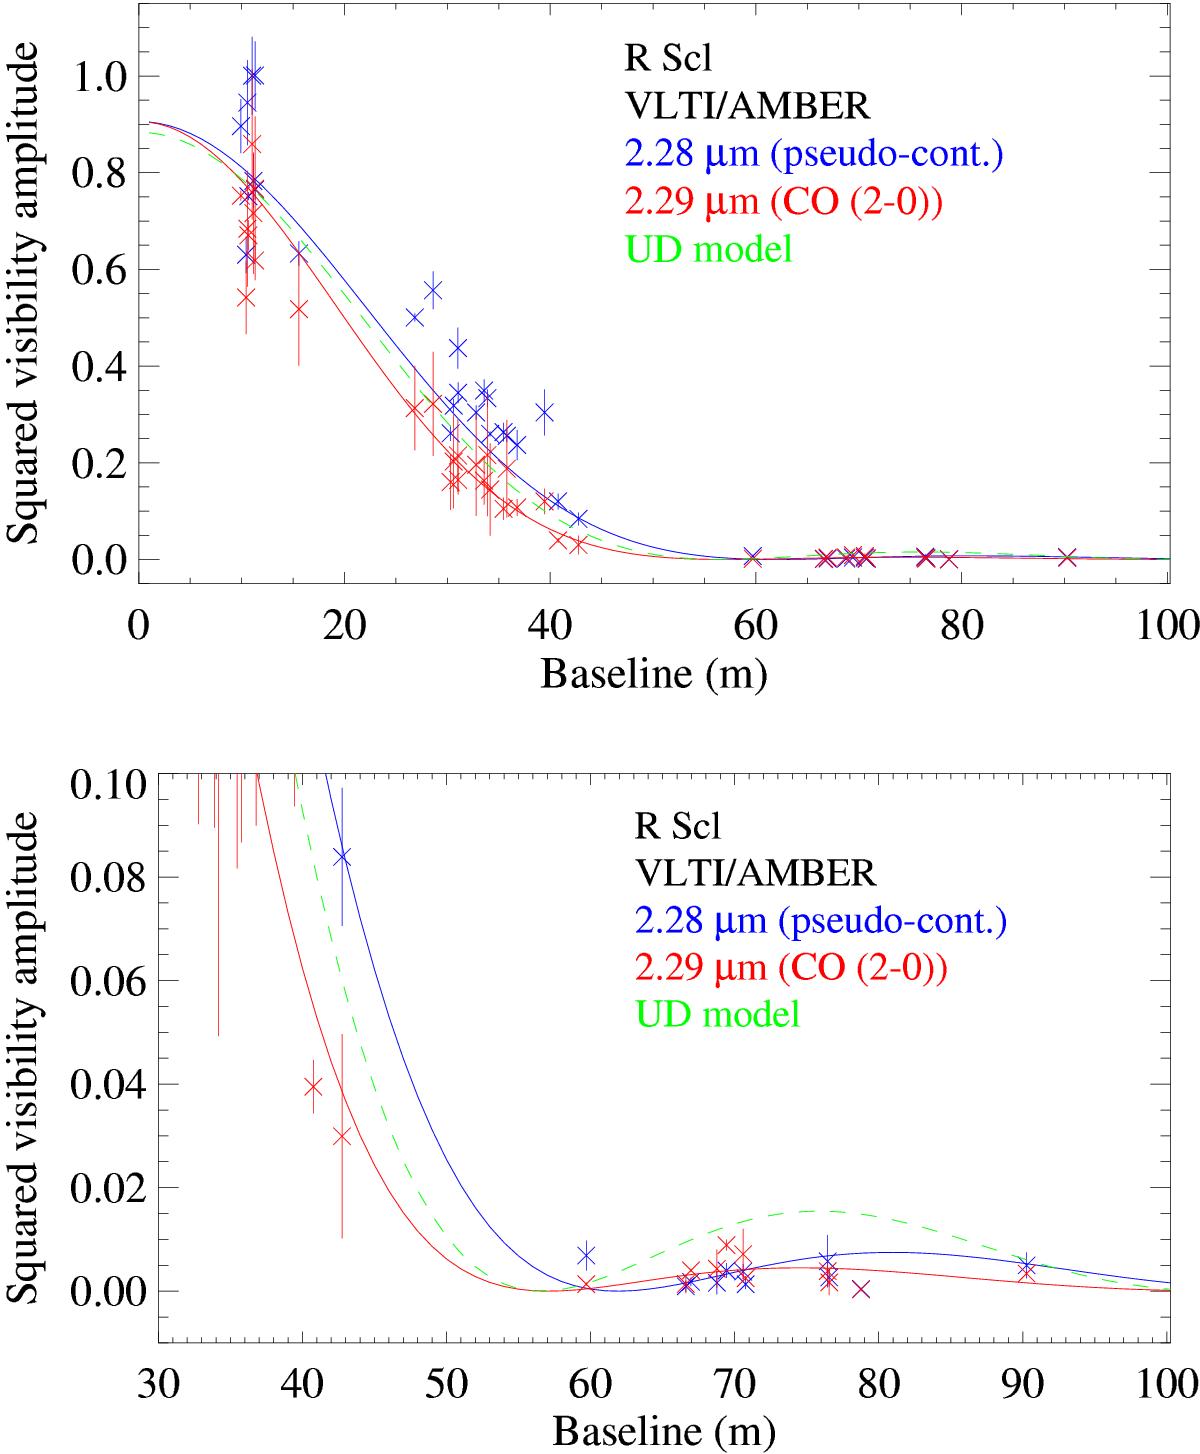
AMBER visibility results as a function of baseline length for the examples of bandpasses in the CO (2-0) line at 2.29 μm and the nearby pseudo-continuum at 2.28 μm. The points with error bars denote the observations. The solid lines denote the synthetic visibility based on the best-fit model atmosphere. The fit was derived from the full data set. The green dotted line shows the result based on the uniform disk (UD) fit. The upper panel shows the full visibility range. The lower panel shows an enlargement of the small visibility values at long baselines.
Current usage metrics show cumulative count of Article Views (full-text article views including HTML views, PDF and ePub downloads, according to the available data) and Abstracts Views on Vision4Press platform.
Data correspond to usage on the plateform after 2015. The current usage metrics is available 48-96 hours after online publication and is updated daily on week days.
Initial download of the metrics may take a while.