Fig. 3
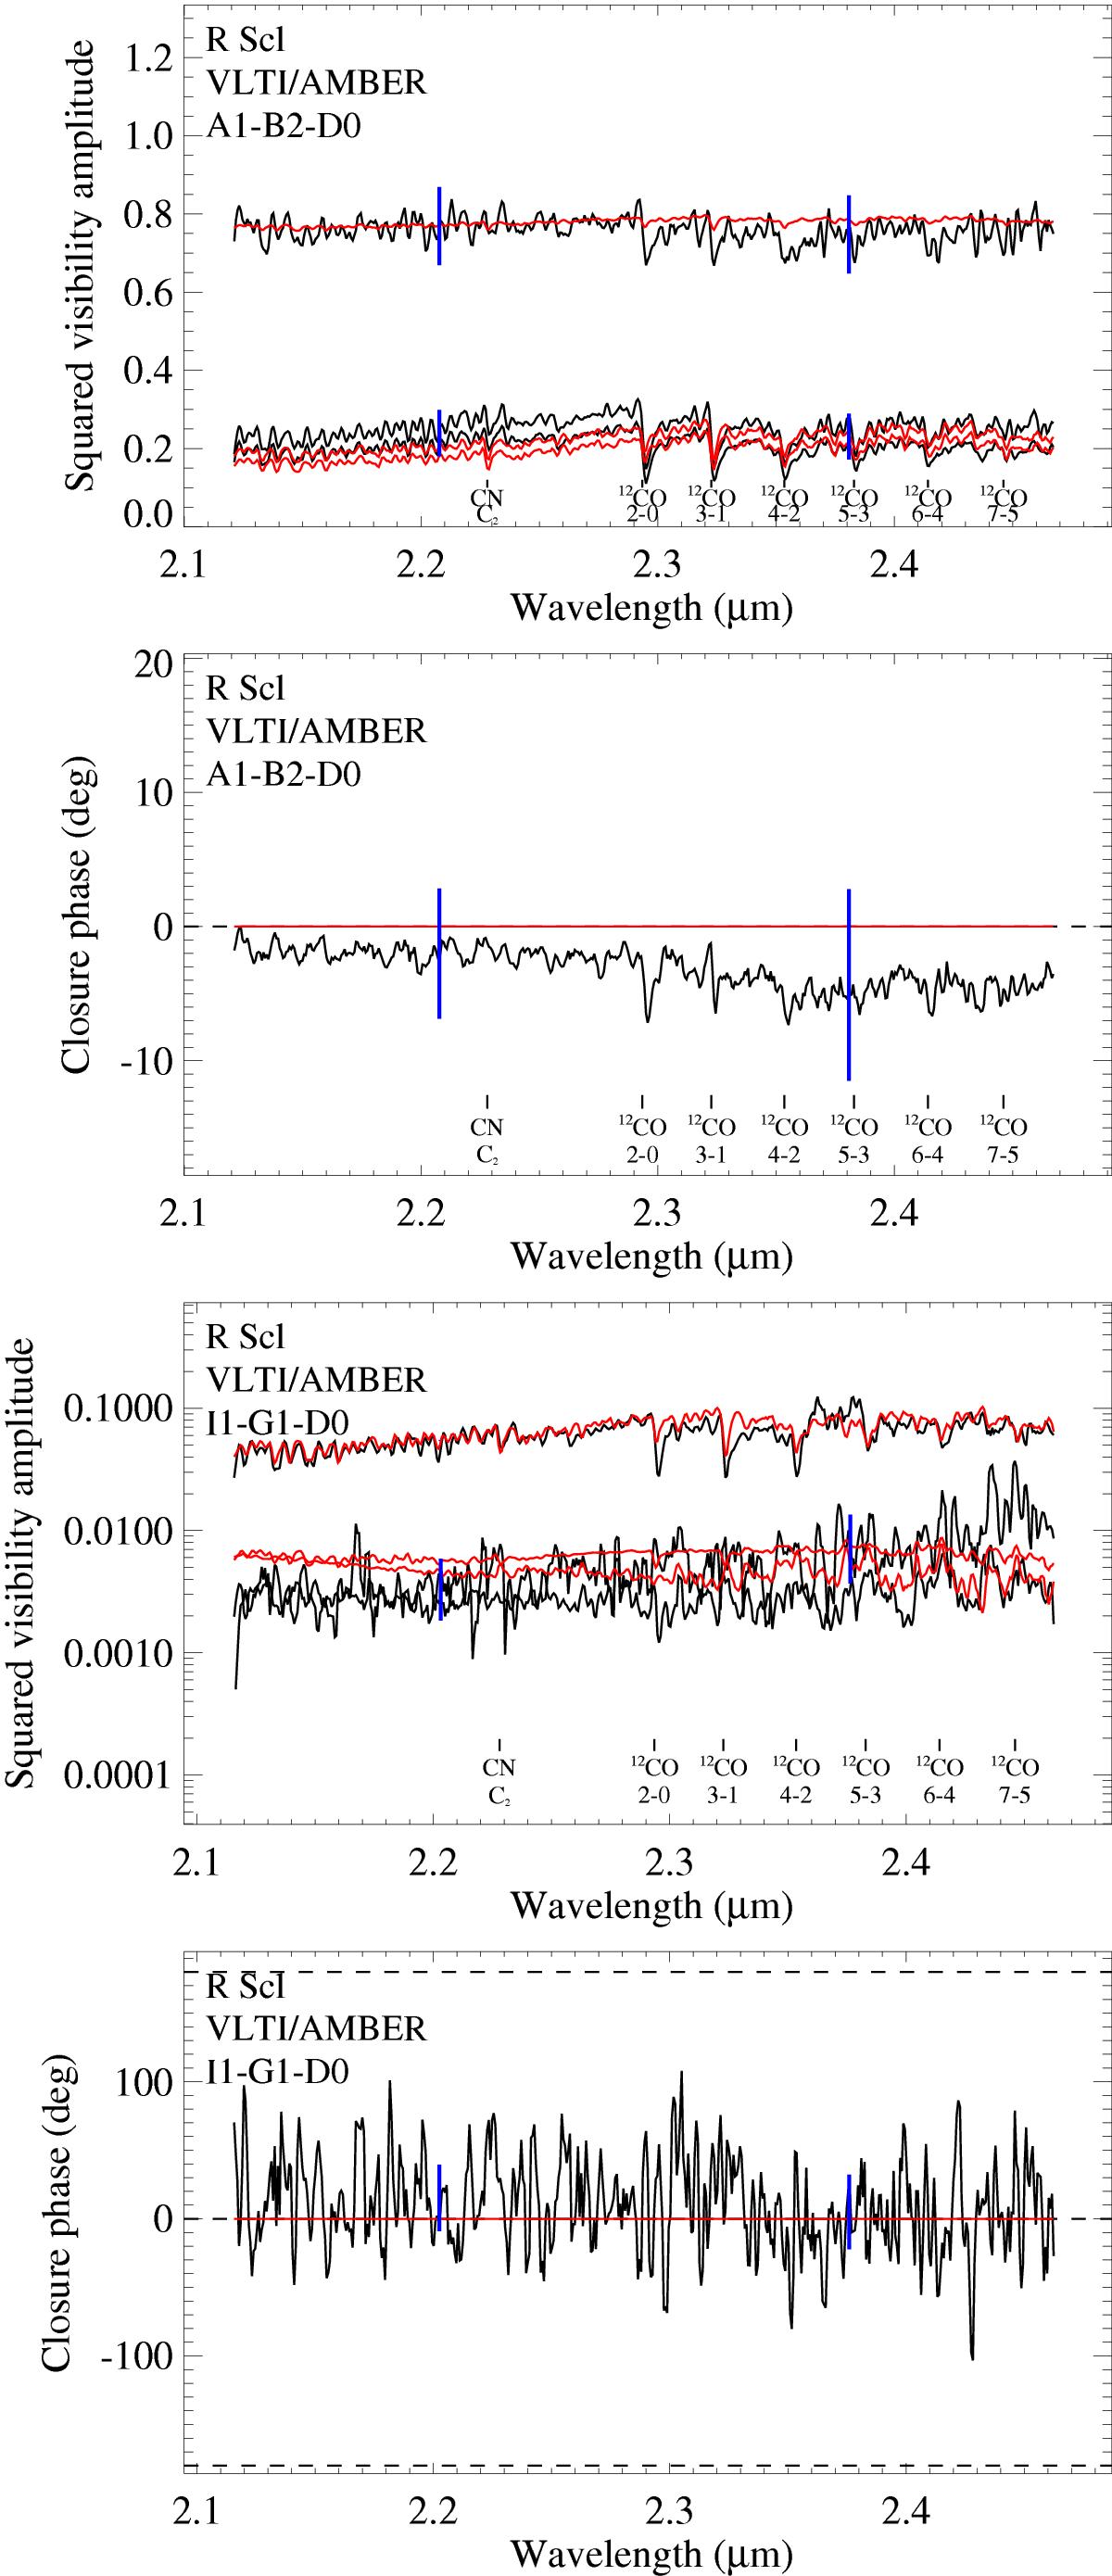
AMBER results (black) compared to the prediction by the best-fit dynamic model (red). The two top panels show the squared visibilities and closure phases versus wavelength for the example of a compact baseline configuration (data set No. 5 in Table 1), followed by an example of an extended configuration (data set No. 9). The blue bars denote the mean errors for the first and second halves of the wavelength range. The three lines correspond to the three baselines of the baseline triplet.
Current usage metrics show cumulative count of Article Views (full-text article views including HTML views, PDF and ePub downloads, according to the available data) and Abstracts Views on Vision4Press platform.
Data correspond to usage on the plateform after 2015. The current usage metrics is available 48-96 hours after online publication and is updated daily on week days.
Initial download of the metrics may take a while.