Free Access
Fig. 2
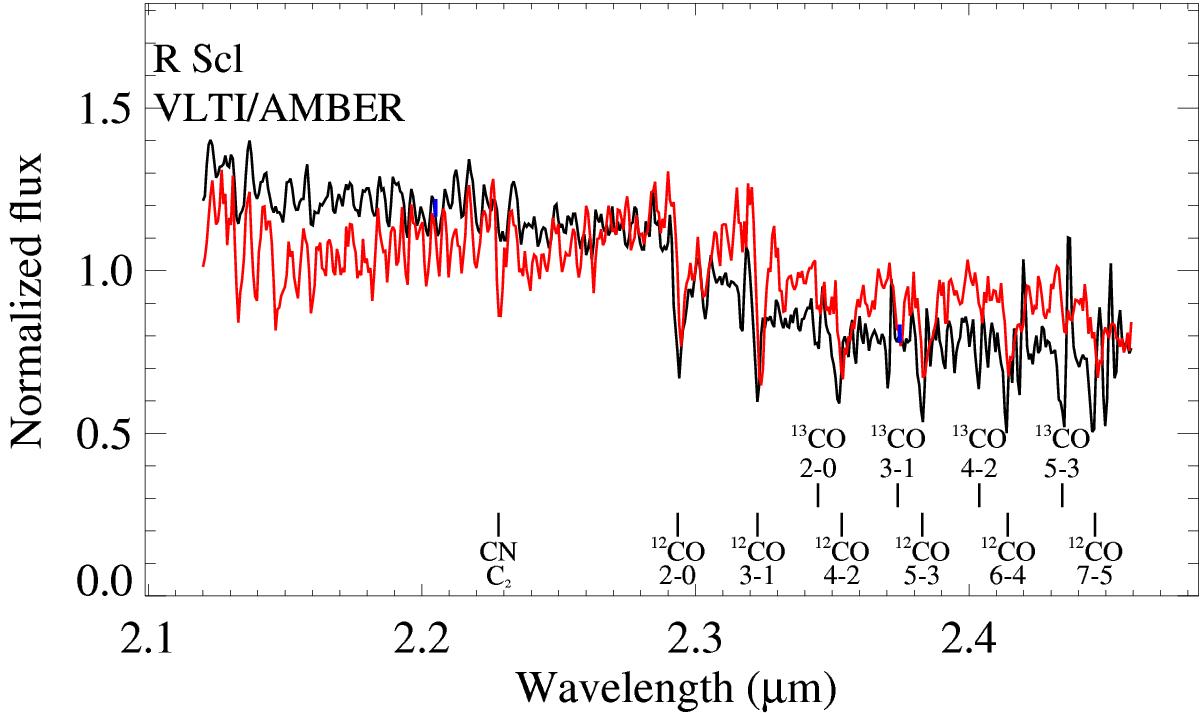
AMBER flux spectrum (black) compared to the prediction by the best-fit dynamic model (red). The blue bars denote the mean errors for the first and second halves of the wavelength range. Instrumental and telluric signatures are calibrated and removed.
Current usage metrics show cumulative count of Article Views (full-text article views including HTML views, PDF and ePub downloads, according to the available data) and Abstracts Views on Vision4Press platform.
Data correspond to usage on the plateform after 2015. The current usage metrics is available 48-96 hours after online publication and is updated daily on week days.
Initial download of the metrics may take a while.