Free Access
Fig. 11
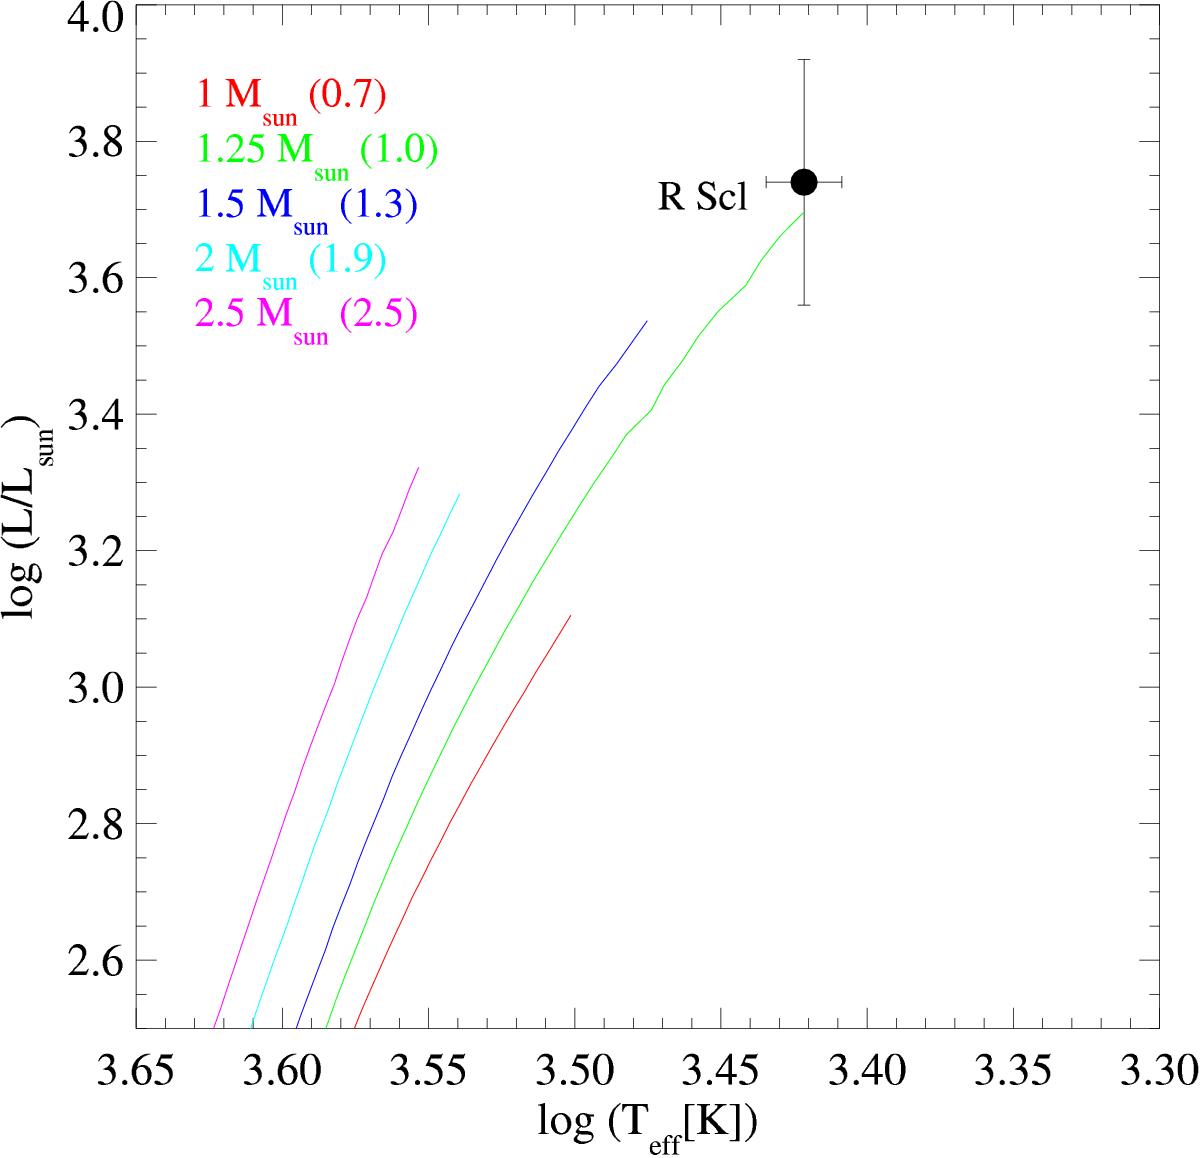
Position of R Scl in the HR diagram together with evolutionary tracks by Lagarde et al. (2012). The tracks are those without rotation and reach up to the start of the TP-AGB. Masses are ZAMS masses; values in parenthesis are masses at the start of the TP-AGB, that is, at the end of the shown tracks.
Current usage metrics show cumulative count of Article Views (full-text article views including HTML views, PDF and ePub downloads, according to the available data) and Abstracts Views on Vision4Press platform.
Data correspond to usage on the plateform after 2015. The current usage metrics is available 48-96 hours after online publication and is updated daily on week days.
Initial download of the metrics may take a while.