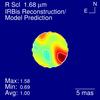
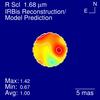
Fig. 10
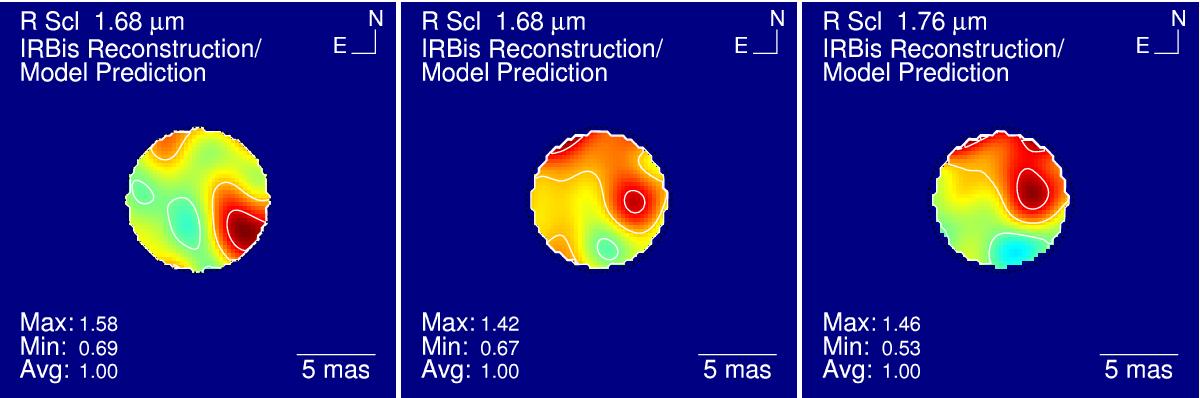
Image reconstructions of R Scl from Fig. 9 divided by the model images from Fig. 8 in order to remove the global center-to-limb intensity variation and to highlight the surface structure on top of this variation. We use a cut-off radius at a model intensity level of 50%, located slightly within the Rosseland radius, which is indicated by the black dashed circle. We calculated the maximum, minimum, and mean intensities inside the cut-off radius to estimate the contrast of the observed structure and printed them on the image. These values are normalized to an average intensity of unity for each spectral channel separately. Contours are drawn at levels of 0.9, 0.7, 0.5.
Current usage metrics show cumulative count of Article Views (full-text article views including HTML views, PDF and ePub downloads, according to the available data) and Abstracts Views on Vision4Press platform.
Data correspond to usage on the plateform after 2015. The current usage metrics is available 48-96 hours after online publication and is updated daily on week days.
Initial download of the metrics may take a while.