Free Access
Fig. 9
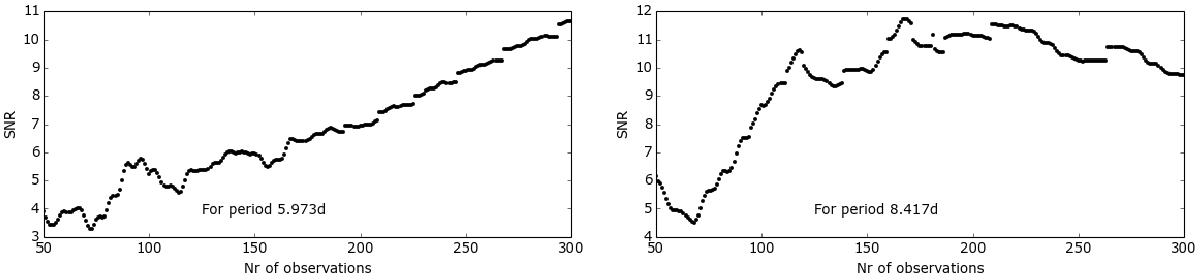
Left: S/NK versus amount of observations for the most significant periodicity in the synthetic dataset plotted top right in Fig. 4. Right: same figure as the left panel, but the best-fitted signal at 5.973 days has been subtracted from the data.
Current usage metrics show cumulative count of Article Views (full-text article views including HTML views, PDF and ePub downloads, according to the available data) and Abstracts Views on Vision4Press platform.
Data correspond to usage on the plateform after 2015. The current usage metrics is available 48-96 hours after online publication and is updated daily on week days.
Initial download of the metrics may take a while.