Free Access
Fig. 4
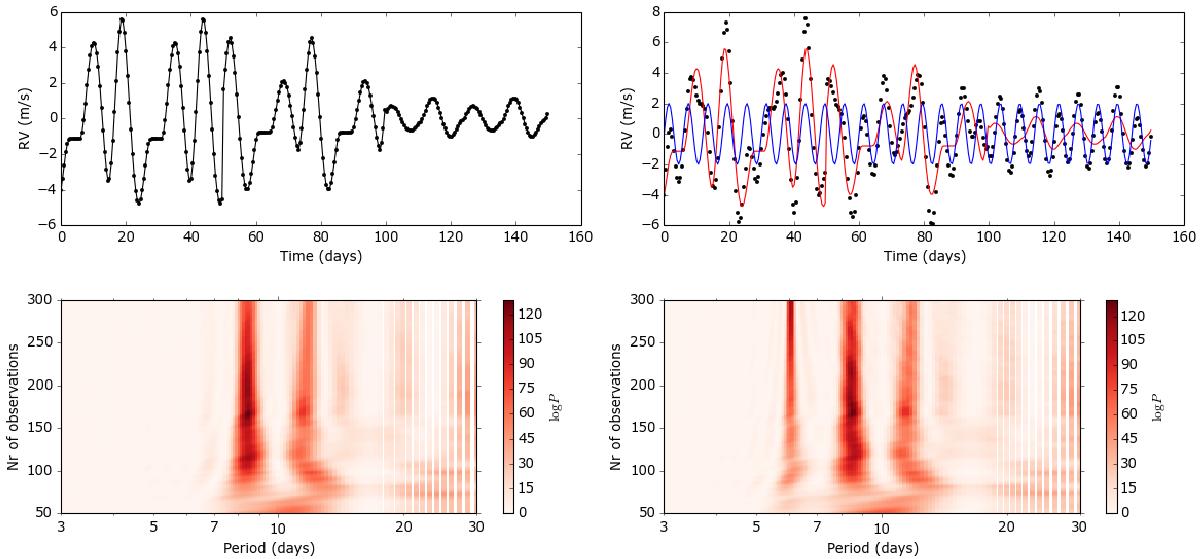
Top left: synthetic RVs generated by SOAP2.0. Top right: black points are the combination of a stellar-activity signal generated by SOAP2.0 (red curve) and a signal of a planet on a six-day circular orbit (blue curve). Bottom: stacked BGLS periodogram for the data in the top plots, colours as in Fig. 1.
Current usage metrics show cumulative count of Article Views (full-text article views including HTML views, PDF and ePub downloads, according to the available data) and Abstracts Views on Vision4Press platform.
Data correspond to usage on the plateform after 2015. The current usage metrics is available 48-96 hours after online publication and is updated daily on week days.
Initial download of the metrics may take a while.