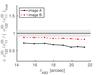
Fig. 9
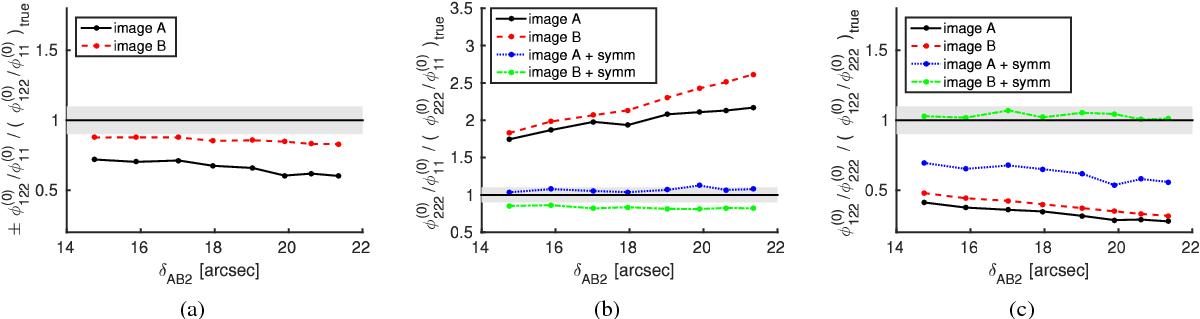
Evaluation of the SIE profile (fold): ratio of Eq. (4)divided by the true value for image A (black solid line) and image B (red dashed line) a). Ratio of Eq. (3)for image A and B and for both images under the symmetry assumption that their orientation is orthogonal to the critical curve (blue dotted line, green dash-dotted line) b). Slope of the critical curve, Eq. (5), at the fold using the ratios obtained in a) and b) c). The grey-shaded area marks 10% deviation from the true ratio.
Current usage metrics show cumulative count of Article Views (full-text article views including HTML views, PDF and ePub downloads, according to the available data) and Abstracts Views on Vision4Press platform.
Data correspond to usage on the plateform after 2015. The current usage metrics is available 48-96 hours after online publication and is updated daily on week days.
Initial download of the metrics may take a while.