Fig. 4
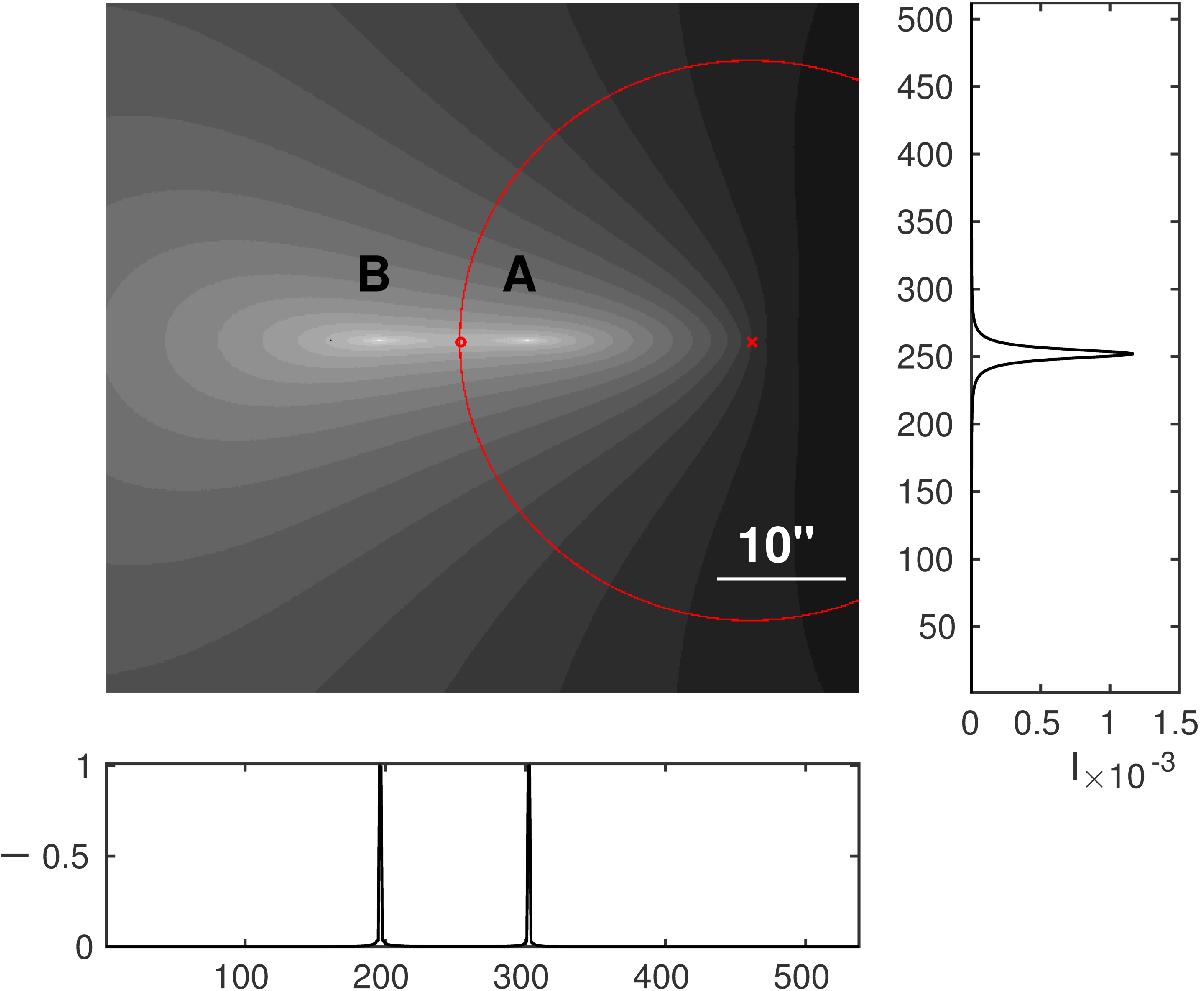
Two-dimensional logarithmic intensity distribution of two images close to the radial critical curve, saddle point image B (left), maximum close to the lens centre A (right), critical curve (red), and centre of the lens (red cross). The plots at the right and bottom show vertical and horizontal intensity profiles through the critical point between A and B (red dot).
Current usage metrics show cumulative count of Article Views (full-text article views including HTML views, PDF and ePub downloads, according to the available data) and Abstracts Views on Vision4Press platform.
Data correspond to usage on the plateform after 2015. The current usage metrics is available 48-96 hours after online publication and is updated daily on week days.
Initial download of the metrics may take a while.