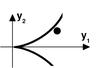
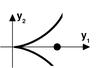
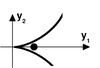
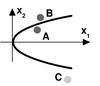
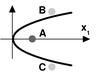
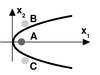
Fig. 2
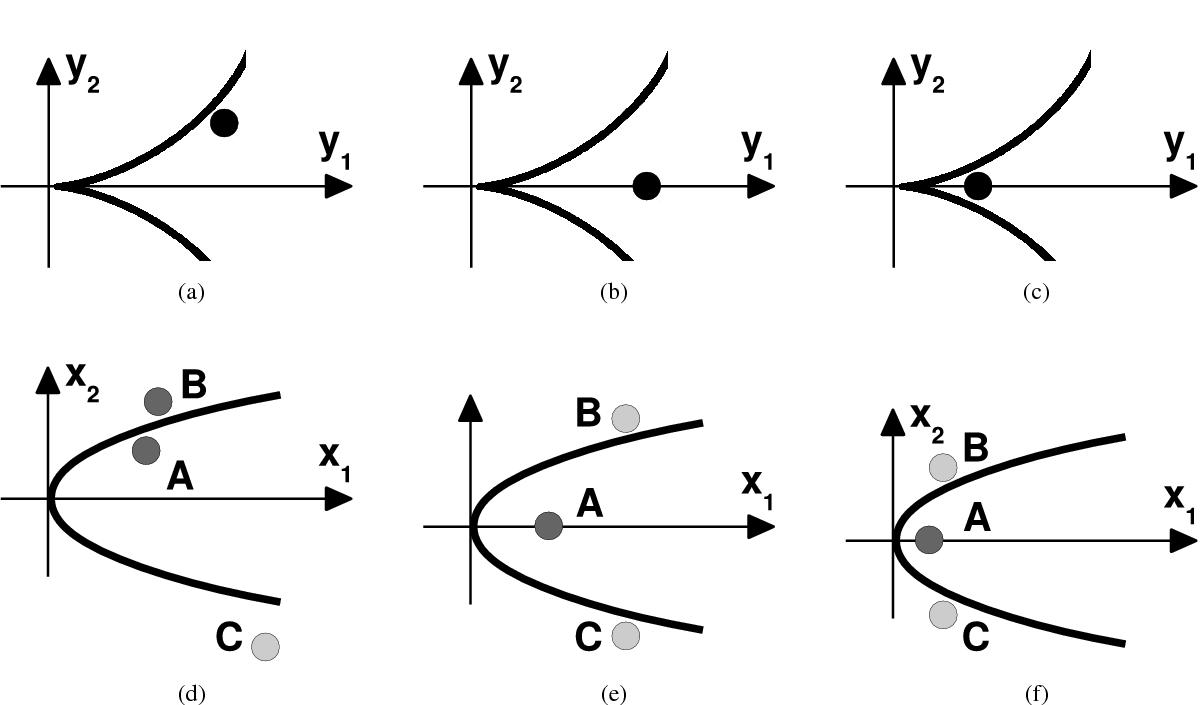
Analysis of the observables in three images d)–f) determines whether to apply the fold or cusp equations and where the source is located with respect to the folds and cusp a)–c): a fold configuration a) and e) shows two highly symmetric images, A, B, with larger separation to the third image, C, less magnified than A, B. In a cusp configuration b) and e), c) and f), A is highly magnified compared to B and C because it can be considered an overlay of two images generated by lensing at the upper and the lower fold which unite at the cusp point. Image shapes are neglected in these graphs, but high and low absolute values of magnifications are indicated by dark and light grey values, respectively.
Current usage metrics show cumulative count of Article Views (full-text article views including HTML views, PDF and ePub downloads, according to the available data) and Abstracts Views on Vision4Press platform.
Data correspond to usage on the plateform after 2015. The current usage metrics is available 48-96 hours after online publication and is updated daily on week days.
Initial download of the metrics may take a while.