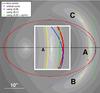
Fig. 12
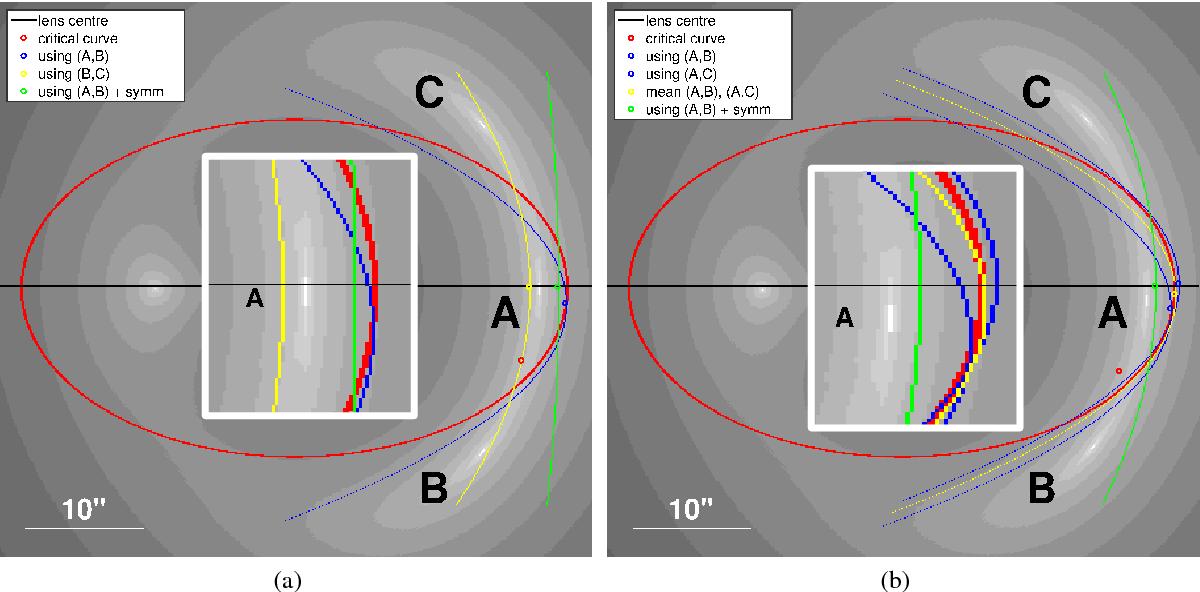
Evaluation of the SIE profile (cusp): reconstruction of the critical curve close to a cusp for a symmetric image configuration a) and for an asymmetric image configuration b). For a) and b), the y1-value of the sources is the same, y2 varied. The symmetry axis through the lens centre (black line) is drawn to better visualise the location of the cusp point (crossing of black line and red curve) and to compare it to the vertex positions (blue, yellow and green dots) for the different reconstructions, marking the reconstructed cusp point. The reconstruction of the fold point between A and B is also shown (red dot). Inset: detail of the cusp position reconstruction.
Current usage metrics show cumulative count of Article Views (full-text article views including HTML views, PDF and ePub downloads, according to the available data) and Abstracts Views on Vision4Press platform.
Data correspond to usage on the plateform after 2015. The current usage metrics is available 48-96 hours after online publication and is updated daily on week days.
Initial download of the metrics may take a while.