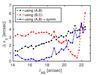
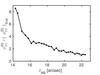
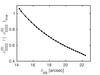
Fig. 10
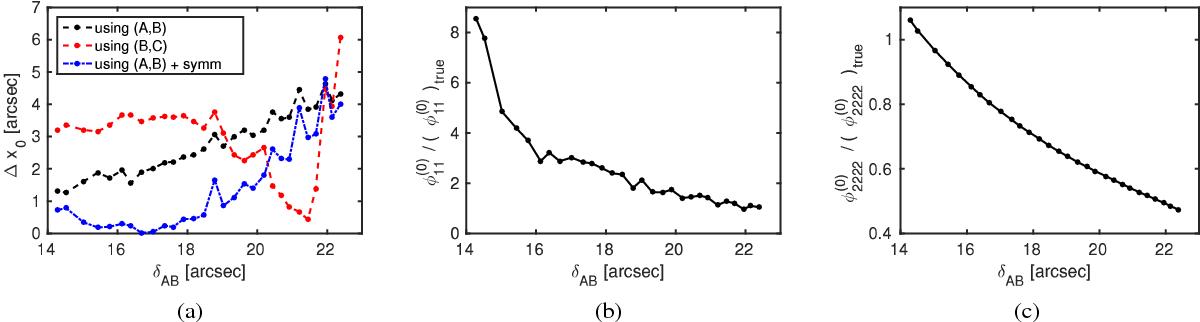
Evaluation of the SIE profile (cusp): deviation of the reconstructed critical point from the true one dependent on the (observable) relative distance between the intensity mean of the two images A and B using the pair (A,B) (black solid line), the pair of positive parity images (B,C) (red dashed line) or the pair (A,B) with the symmetry assumption that image orientation angles are parallel to the critical curve at the cusp (blue, dash-dotted line) a). Using (A,C) yields the same result as (A,B) because the source lies on the symmetry axis between B and C. The accuracy of Eq. (7)dependent on the same distance between images A and Bb) and accuracy of the analogue to Eq. (7) under the symmetry assumption stated in Wagner & Bartelmann (2016)c).
Current usage metrics show cumulative count of Article Views (full-text article views including HTML views, PDF and ePub downloads, according to the available data) and Abstracts Views on Vision4Press platform.
Data correspond to usage on the plateform after 2015. The current usage metrics is available 48-96 hours after online publication and is updated daily on week days.
Initial download of the metrics may take a while.