Fig. 4
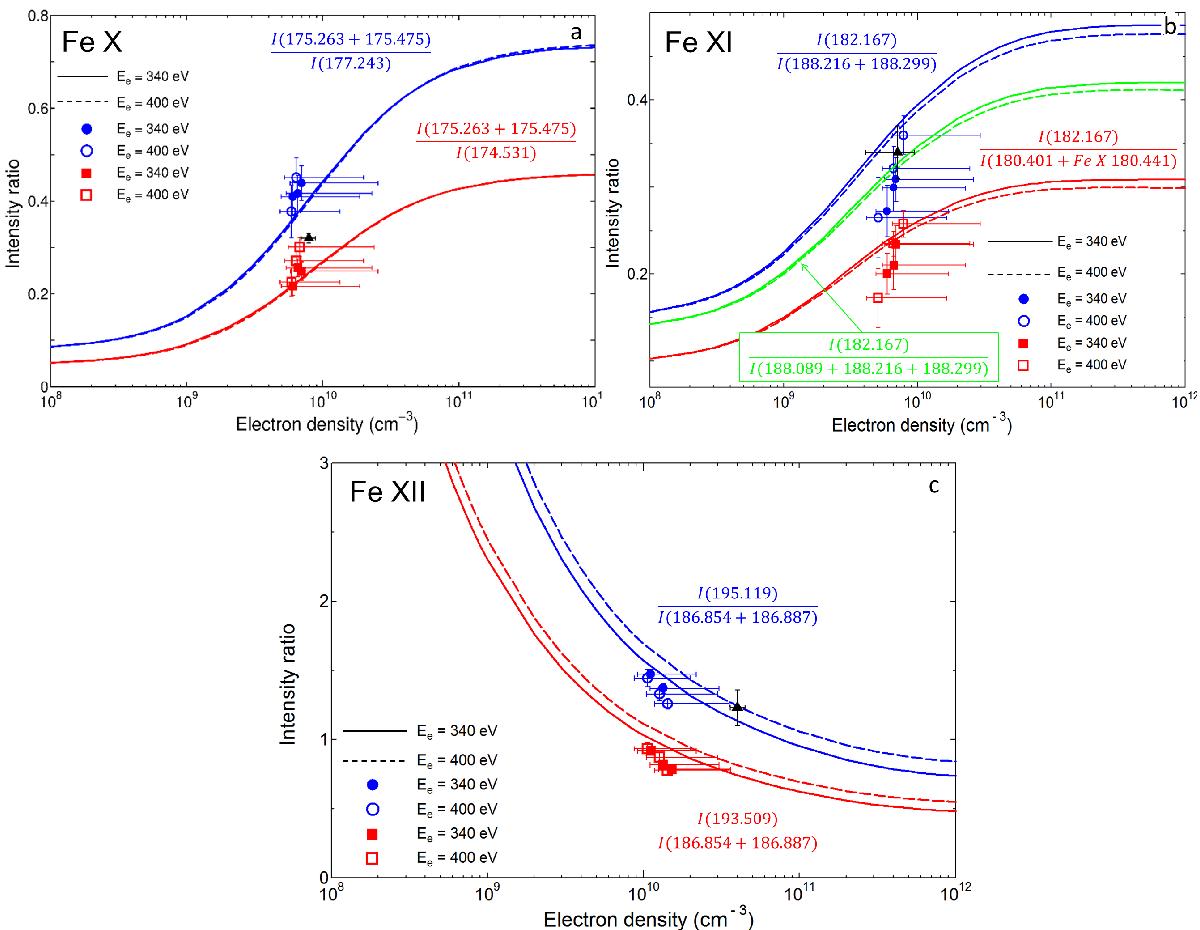
Comparison of the measured and calculated line intensity ratios for a) Fe X: I(175.263+175.475)/I(177.243) and I(175.263+175.475)/I(174.531); b) Fe XI: I(182.167)/I(188.089+ 188.216+188.299) and I(182.167)/ I(180.401+Fe X 180.441); and c) Fe XII: I(195.119)/I(186.854+186.887) and I(193.509)/ I(186.854+186.887). The vertical error bars were estimated from fitting the Gaussian peak profiles (1σ). Positive horizontal error bars represents maximum electron density at the centre of the Gaussian electron beam and ion cloud, while negative horizontal error bars represents mechanical uncertainty (pinhole camera and visible spectrometer). The symbols with error bars are the measured intensity ratios for electron beam energies of 340 eV (closed squares and circles) and 400 eV (open squares and circles). The solid and dashed lines in a)−c) are our calculated result for 340 and 400 eV, respectively. The filled triangles with error bars represents FLASH-EBIT data taken from Liang et al. (2009a). Typical values of the geometrical electron beam densities found in the present work ranges from 2.6 to 4.3 × 1010 cm-3.
Current usage metrics show cumulative count of Article Views (full-text article views including HTML views, PDF and ePub downloads, according to the available data) and Abstracts Views on Vision4Press platform.
Data correspond to usage on the plateform after 2015. The current usage metrics is available 48-96 hours after online publication and is updated daily on week days.
Initial download of the metrics may take a while.