Fig. 3
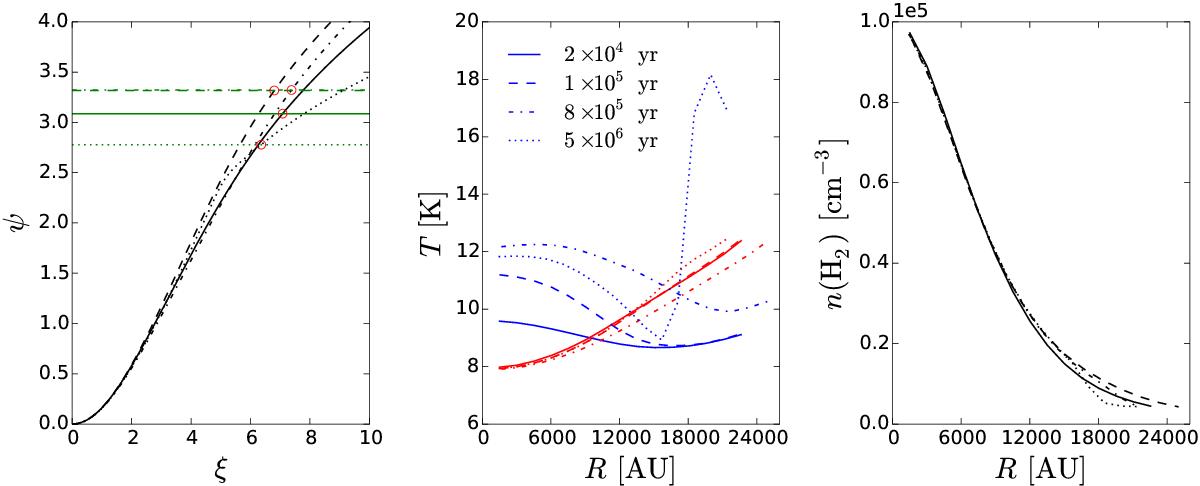
Left-hand panel: function ψ for core A at selected time steps, indicated in the middle panel of the figure. The green horizontal lines mark the value of ψ that satisfies Eq. (6) at each time step, and the red circles are a guide for the eye to locate the corresponding value of ξout (see text). Middle panel: dust (red) and gas (blue) temperature profiles for core A as functions of distance from the core center at different times. Right-hand panel: density profile for core A as a function of distance from the core center at different times. The quoted times are approximate because the time steps considered in the model, save for the first and last, are not exact multiples of ten.
Current usage metrics show cumulative count of Article Views (full-text article views including HTML views, PDF and ePub downloads, according to the available data) and Abstracts Views on Vision4Press platform.
Data correspond to usage on the plateform after 2015. The current usage metrics is available 48-96 hours after online publication and is updated daily on week days.
Initial download of the metrics may take a while.