Fig. 8
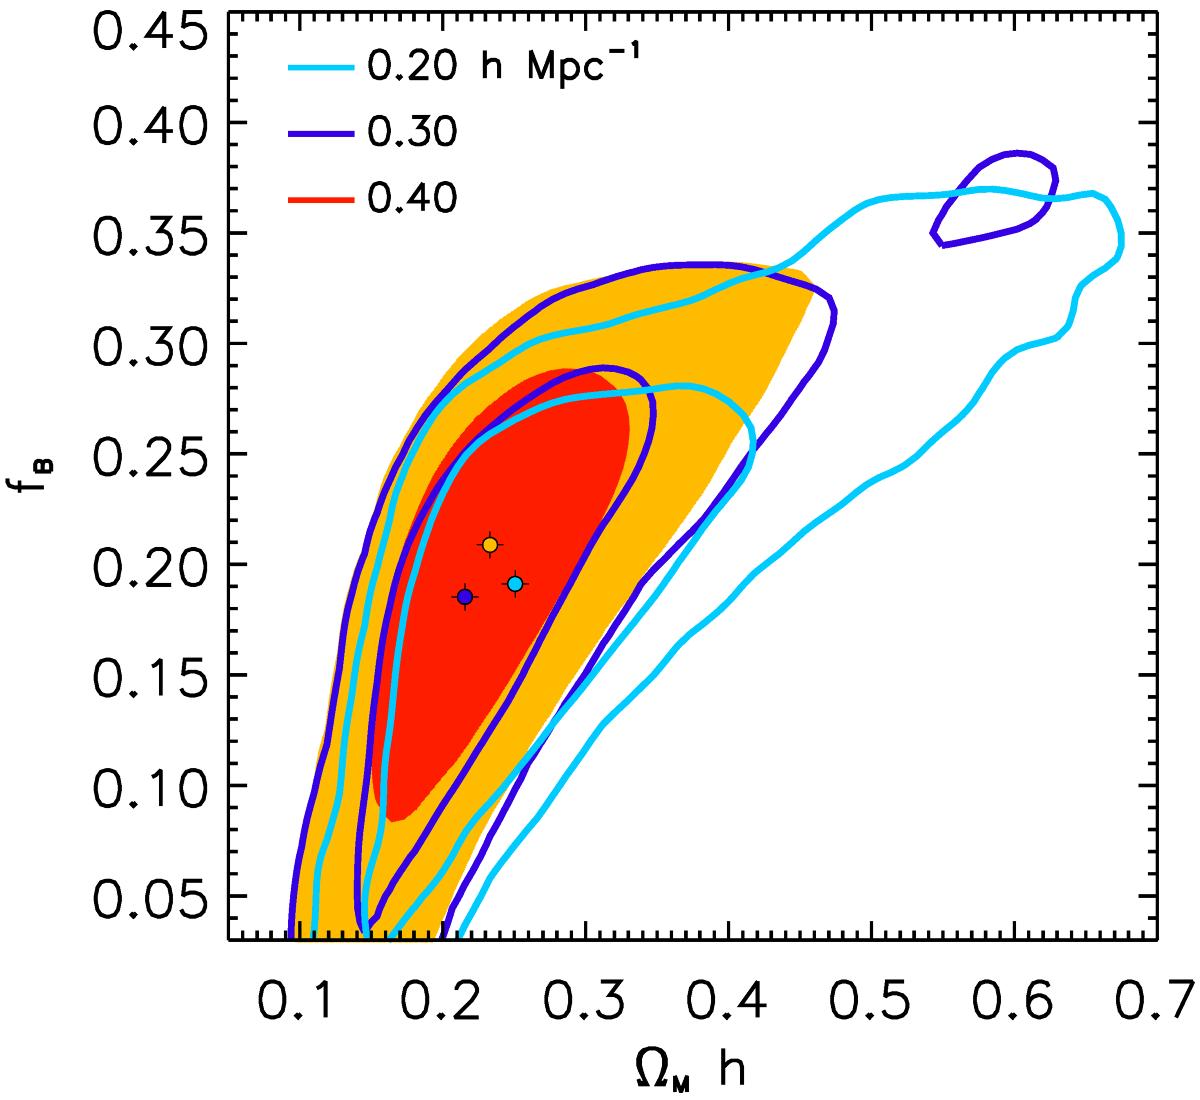
Stability of the estimates of ΩMh and fB when varying the minimum fitting scale kmax. The contours show 68 and 95% confidence levels. The filled contour corresponds to kmax = 0.40 h Mpc-1. The best-fit from each likelihood analysis is marked with a cross. No systematic trend with kmax is evident, confirming the conclusions drawn using the mock samples in Sect. 5.2.
Current usage metrics show cumulative count of Article Views (full-text article views including HTML views, PDF and ePub downloads, according to the available data) and Abstracts Views on Vision4Press platform.
Data correspond to usage on the plateform after 2015. The current usage metrics is available 48-96 hours after online publication and is updated daily on week days.
Initial download of the metrics may take a while.