Fig. 4
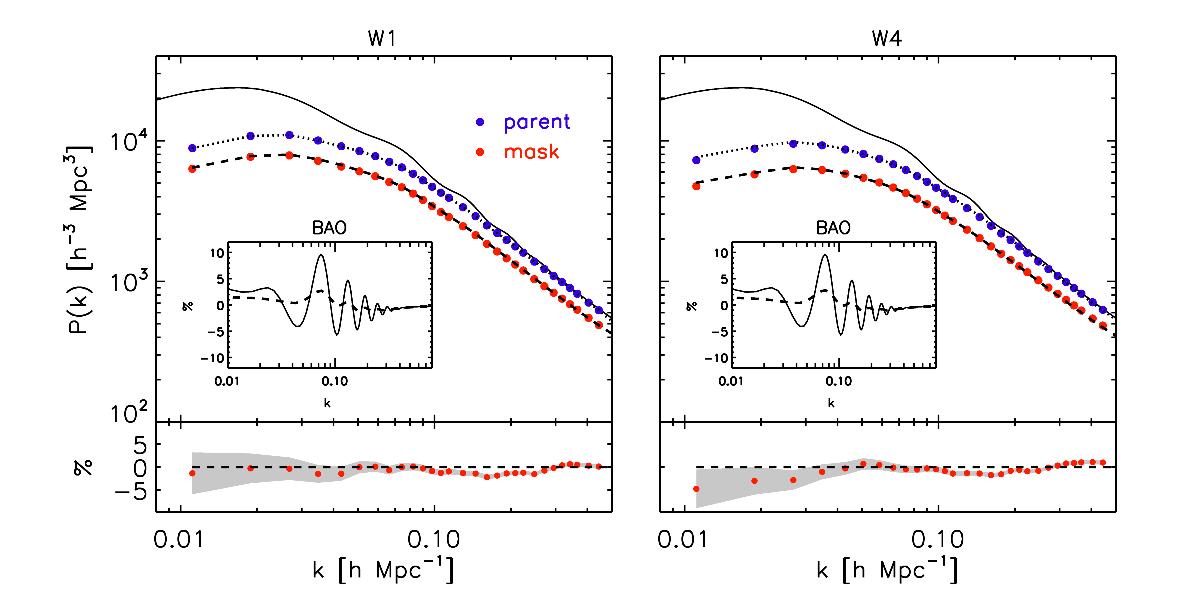
Modelling the effects of the survey window function. The effects of the simplified geometry of the survey only, i.e. the parent sample (filled blue circles) and of the full angular mask (filled red circles) are compared. The dashed and dotted lines show how well these effects are modelled by convolving the input P(k) (solid line) with our model for the window functions of the two cases. The relative accuracy in the case of the full window function (geometry plus mask) is explicitly shown in the bottom panel. The insets show a blow-up of the Baryonic Acoustic Oscillations, obtained by dividing the input spectrum by a “no-wiggles" one (solid line). This is compared to the actual signal expected when P(k) is convolved with the VIPERS window function (dashed line).
Current usage metrics show cumulative count of Article Views (full-text article views including HTML views, PDF and ePub downloads, according to the available data) and Abstracts Views on Vision4Press platform.
Data correspond to usage on the plateform after 2015. The current usage metrics is available 48-96 hours after online publication and is updated daily on week days.
Initial download of the metrics may take a while.