Fig. 1
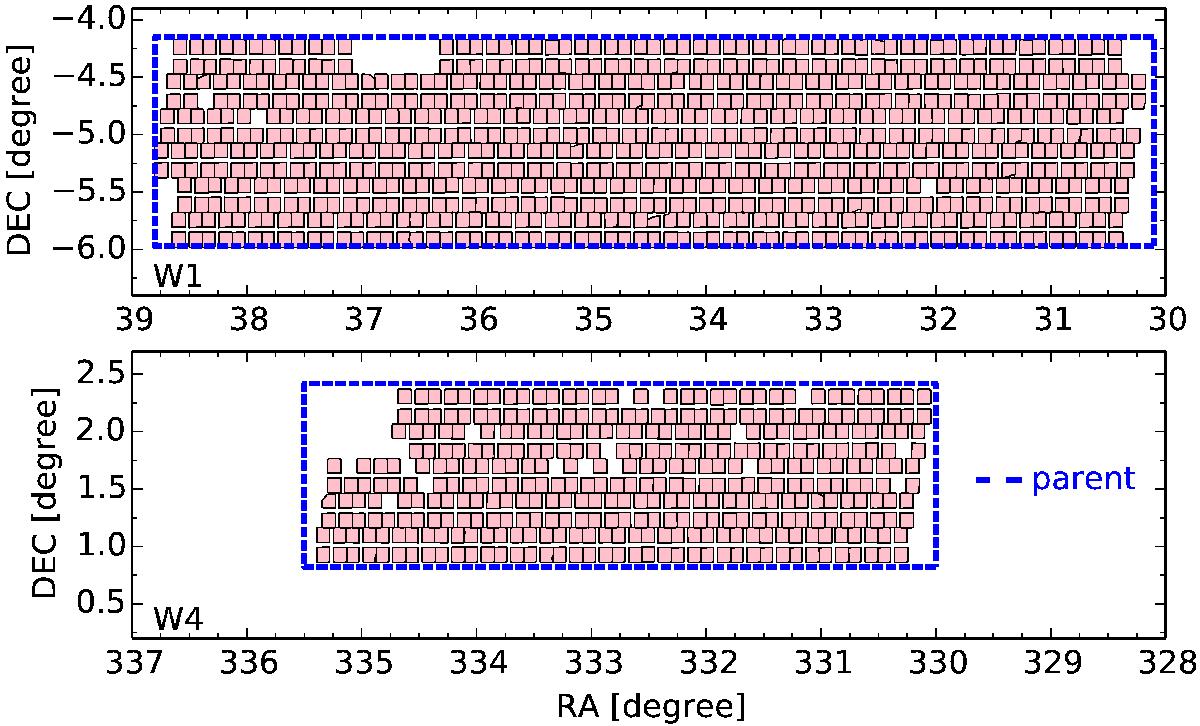
Angular distribution of the full VIPERS galaxy sample, as used for this study (each pink rectangle corresponds to a single quadrant). This shows clearly the geometry and mask produced by the VIMOS footprint. The dashed blue contours define the area of what we call the “parent sample” when we study the survey window function and selection/modelling effects through the use of mock surveys.
Current usage metrics show cumulative count of Article Views (full-text article views including HTML views, PDF and ePub downloads, according to the available data) and Abstracts Views on Vision4Press platform.
Data correspond to usage on the plateform after 2015. The current usage metrics is available 48-96 hours after online publication and is updated daily on week days.
Initial download of the metrics may take a while.