Free Access
Fig. 6
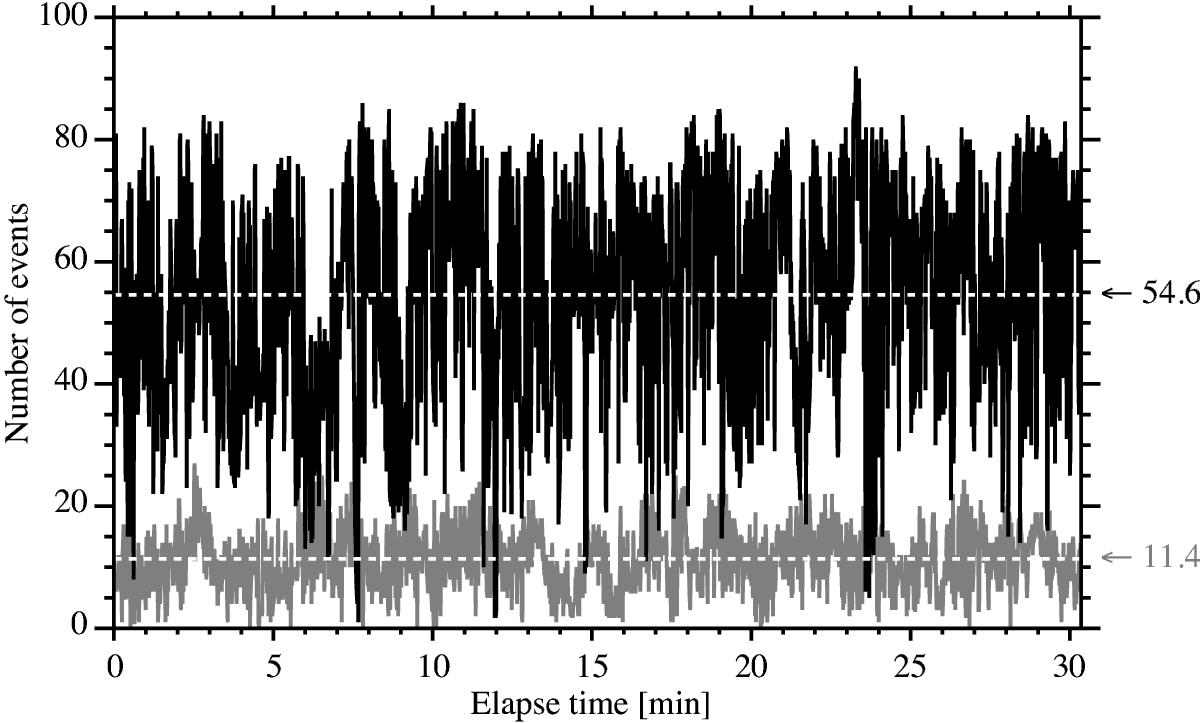
Number of events detected with the vorticity strength method (grey curve) and with the enhanced vorticity method (black curve). The time-averaged numbers of events detected with the vorticity strength and the enhanced vorticity methods are 54.6 and 11.4, respectively.
Current usage metrics show cumulative count of Article Views (full-text article views including HTML views, PDF and ePub downloads, according to the available data) and Abstracts Views on Vision4Press platform.
Data correspond to usage on the plateform after 2015. The current usage metrics is available 48-96 hours after online publication and is updated daily on week days.
Initial download of the metrics may take a while.