Fig. 5
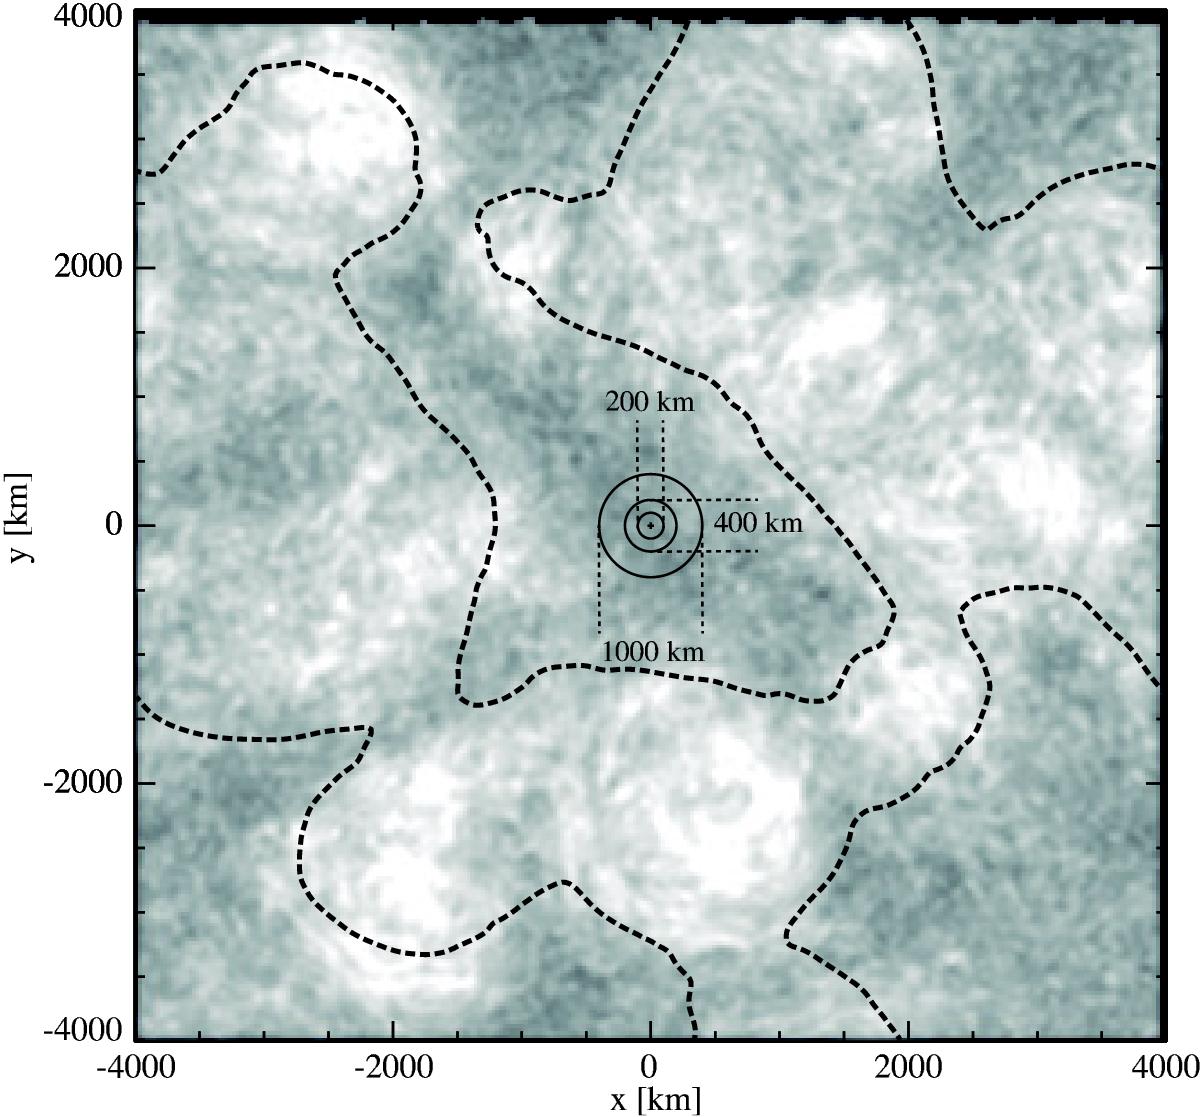
LIC imaging averaged over the sampled time period of 30 min in the simulation. The location of the test vortices are indicated by a black cross at (x, y) = (0, 0) and black circles with diameters of D0 = 200 km, 400 km, and 1000 km, respectively. The strong magnetic field region is indicated by a dashed contour line enclosing the region in which the time-averaged magnetic field strength is larger than the initial magnetic field strength of 50 G.
Current usage metrics show cumulative count of Article Views (full-text article views including HTML views, PDF and ePub downloads, according to the available data) and Abstracts Views on Vision4Press platform.
Data correspond to usage on the plateform after 2015. The current usage metrics is available 48-96 hours after online publication and is updated daily on week days.
Initial download of the metrics may take a while.