Fig. 4
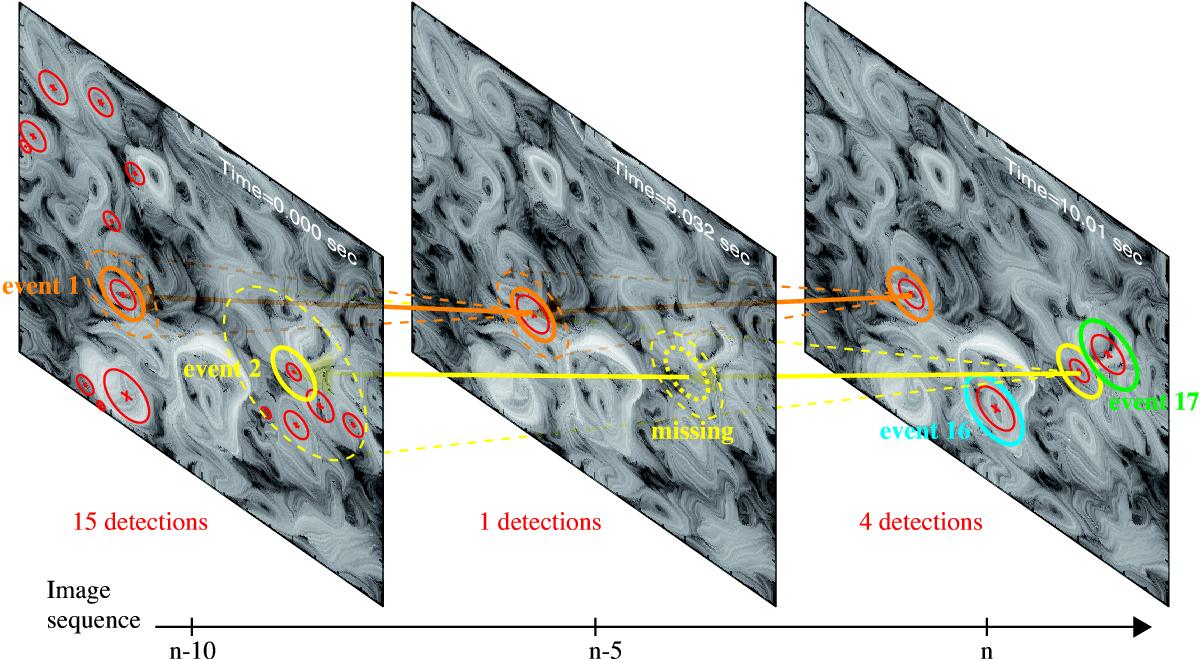
Schematic illustration of how the detected features (red crosses in circles) are attributed to the same events in an image sequence. Orange, yellow, light-blue, and green circles indicate the identified events 1, 2, 16, and 17. The orange and yellow dashed lines illustrate the characteristic cone corresponding to a fixed characteristic speed (e.g. either the sound speed or the Aflvén speed). We choose to scan ten timesteps backwards to check the connectivity between the detected features and to confirm that they belong to the same event as illustrated for event 2. Involving several timesteps is important in case the event is not properly, or not all, detected in an intermediate timestep. In case of multiple detection candidates for the connectivity (e.g. multiple detections within a yellow dashed circle), we select the candidate being closest in terms of location and size.
Current usage metrics show cumulative count of Article Views (full-text article views including HTML views, PDF and ePub downloads, according to the available data) and Abstracts Views on Vision4Press platform.
Data correspond to usage on the plateform after 2015. The current usage metrics is available 48-96 hours after online publication and is updated daily on week days.
Initial download of the metrics may take a while.