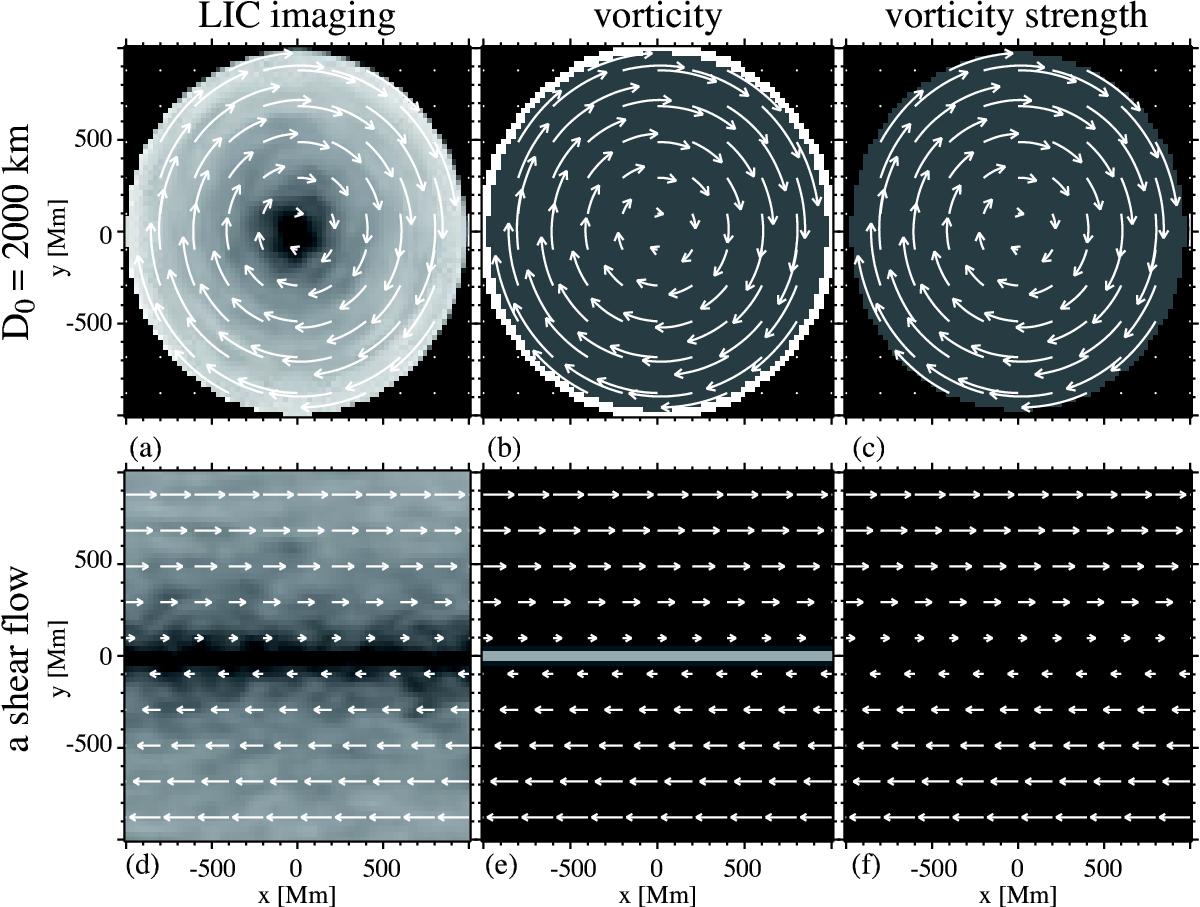
Fig. 2

Comparison between LIC imaging, vorticity, and vorticity strength of a solid rotation (upper panels) and that of a shear flow (lower panels) indicated by white arrows. Upper panels: a) the horizontal velocity amplitude of a swirling feature is illustrated by the LIC imaging, b) the tangential discontinuity at the edge of a swirling feature is enhanced by the vorticity, and c) the constant angular rotation speed of a swirling feature is depicted by the vorticity strength. Lower panels: d) same as a) but for a shear flow, e) a gap between the rightward and leftward velocity at y = 0 is illustrated by the vorticity, and f) there are no features shown by the vorticity strength.
Current usage metrics show cumulative count of Article Views (full-text article views including HTML views, PDF and ePub downloads, according to the available data) and Abstracts Views on Vision4Press platform.
Data correspond to usage on the plateform after 2015. The current usage metrics is available 48-96 hours after online publication and is updated daily on week days.
Initial download of the metrics may take a while.


