Free Access
Fig. 1
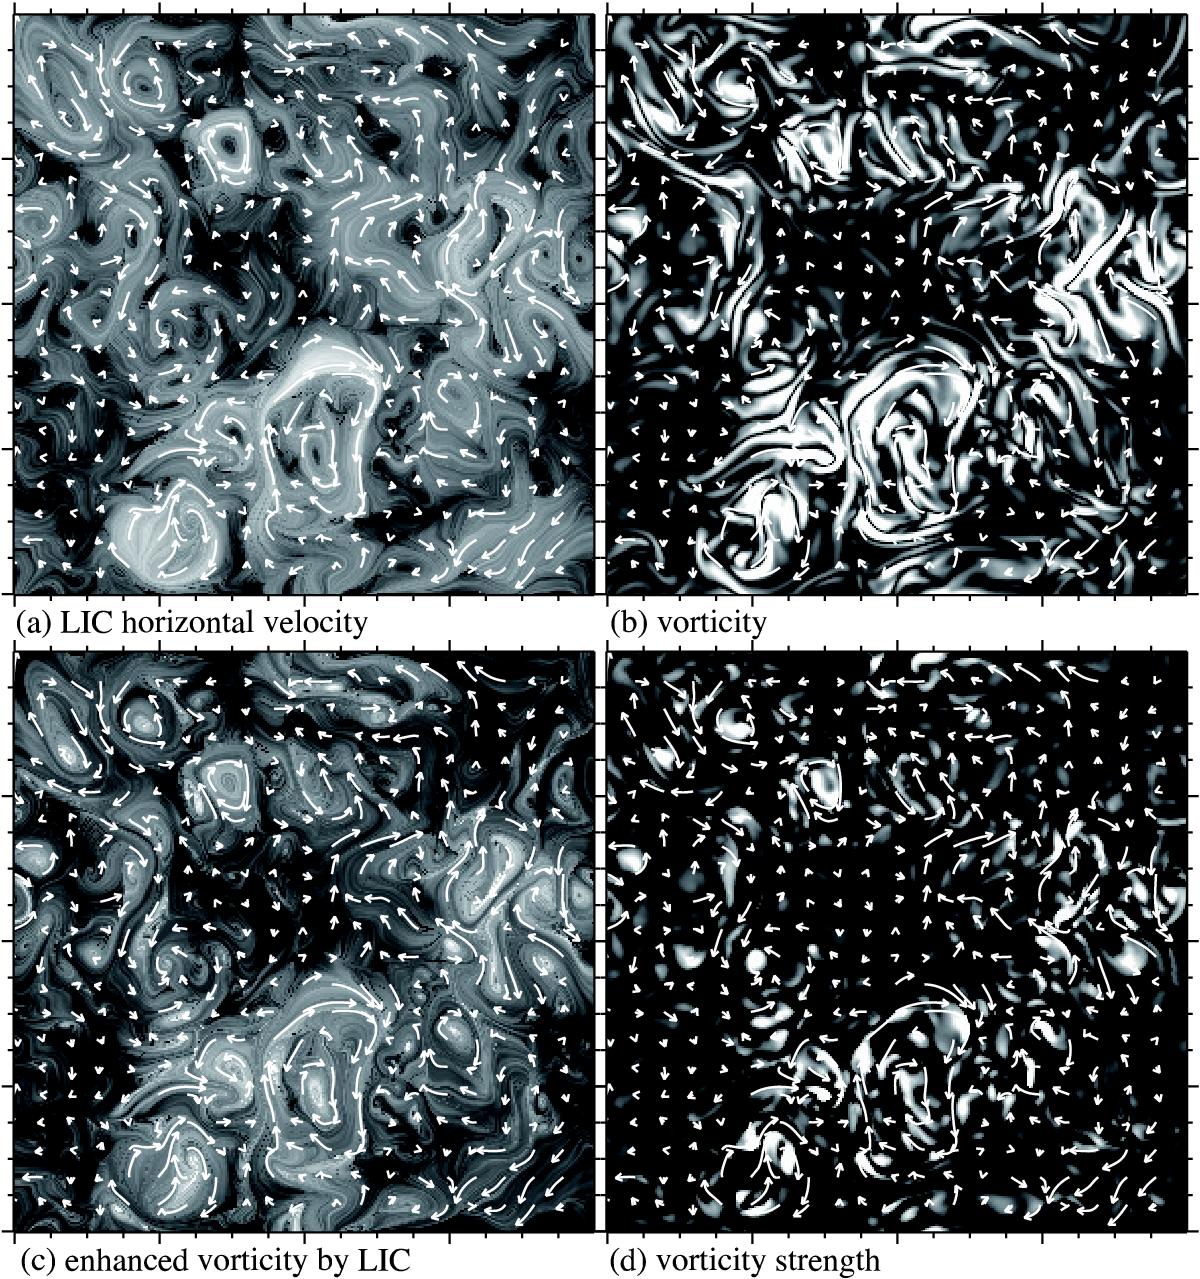
Sample images illustrating the velocity distribution of a snapshot in our simulation (8 Mm × 8 Mm). a) LIC imaging scaled by the horizontal velocity amplitude, b) vorticity, c) LIC imaging scaled by the vorticity amplitude, and d) vorticity strength. Arrows indicate the velocity field.
Current usage metrics show cumulative count of Article Views (full-text article views including HTML views, PDF and ePub downloads, according to the available data) and Abstracts Views on Vision4Press platform.
Data correspond to usage on the plateform after 2015. The current usage metrics is available 48-96 hours after online publication and is updated daily on week days.
Initial download of the metrics may take a while.