Fig. 6
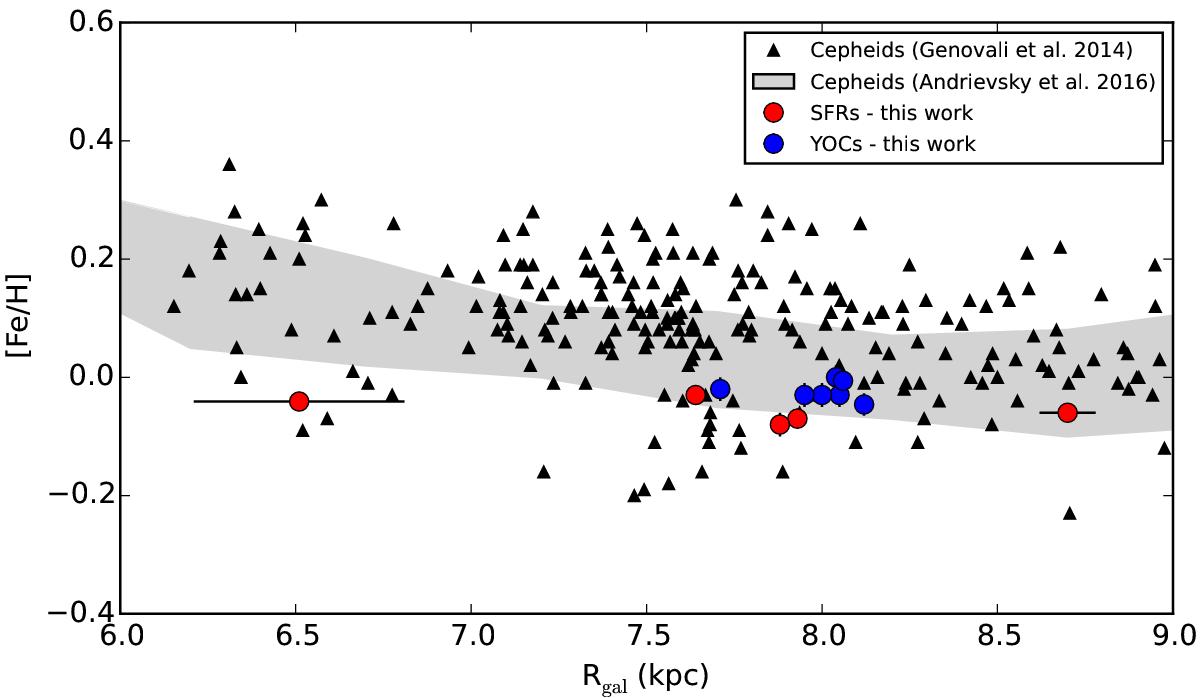
Comparison between the metallicity distributions of SFRs and YOCs by our analysis (red and blue dots, respectively) and those of Cepheids (triangles and grey area). The black triangles represent the values reported in Tables 3 and 4 of Genovali et al. (2014). The grey coloured area contains the bulk of the Cepheids distribution discussed in Andrievsky et al. (2016).
Current usage metrics show cumulative count of Article Views (full-text article views including HTML views, PDF and ePub downloads, according to the available data) and Abstracts Views on Vision4Press platform.
Data correspond to usage on the plateform after 2015. The current usage metrics is available 48-96 hours after online publication and is updated daily on week days.
Initial download of the metrics may take a while.