Fig. 2
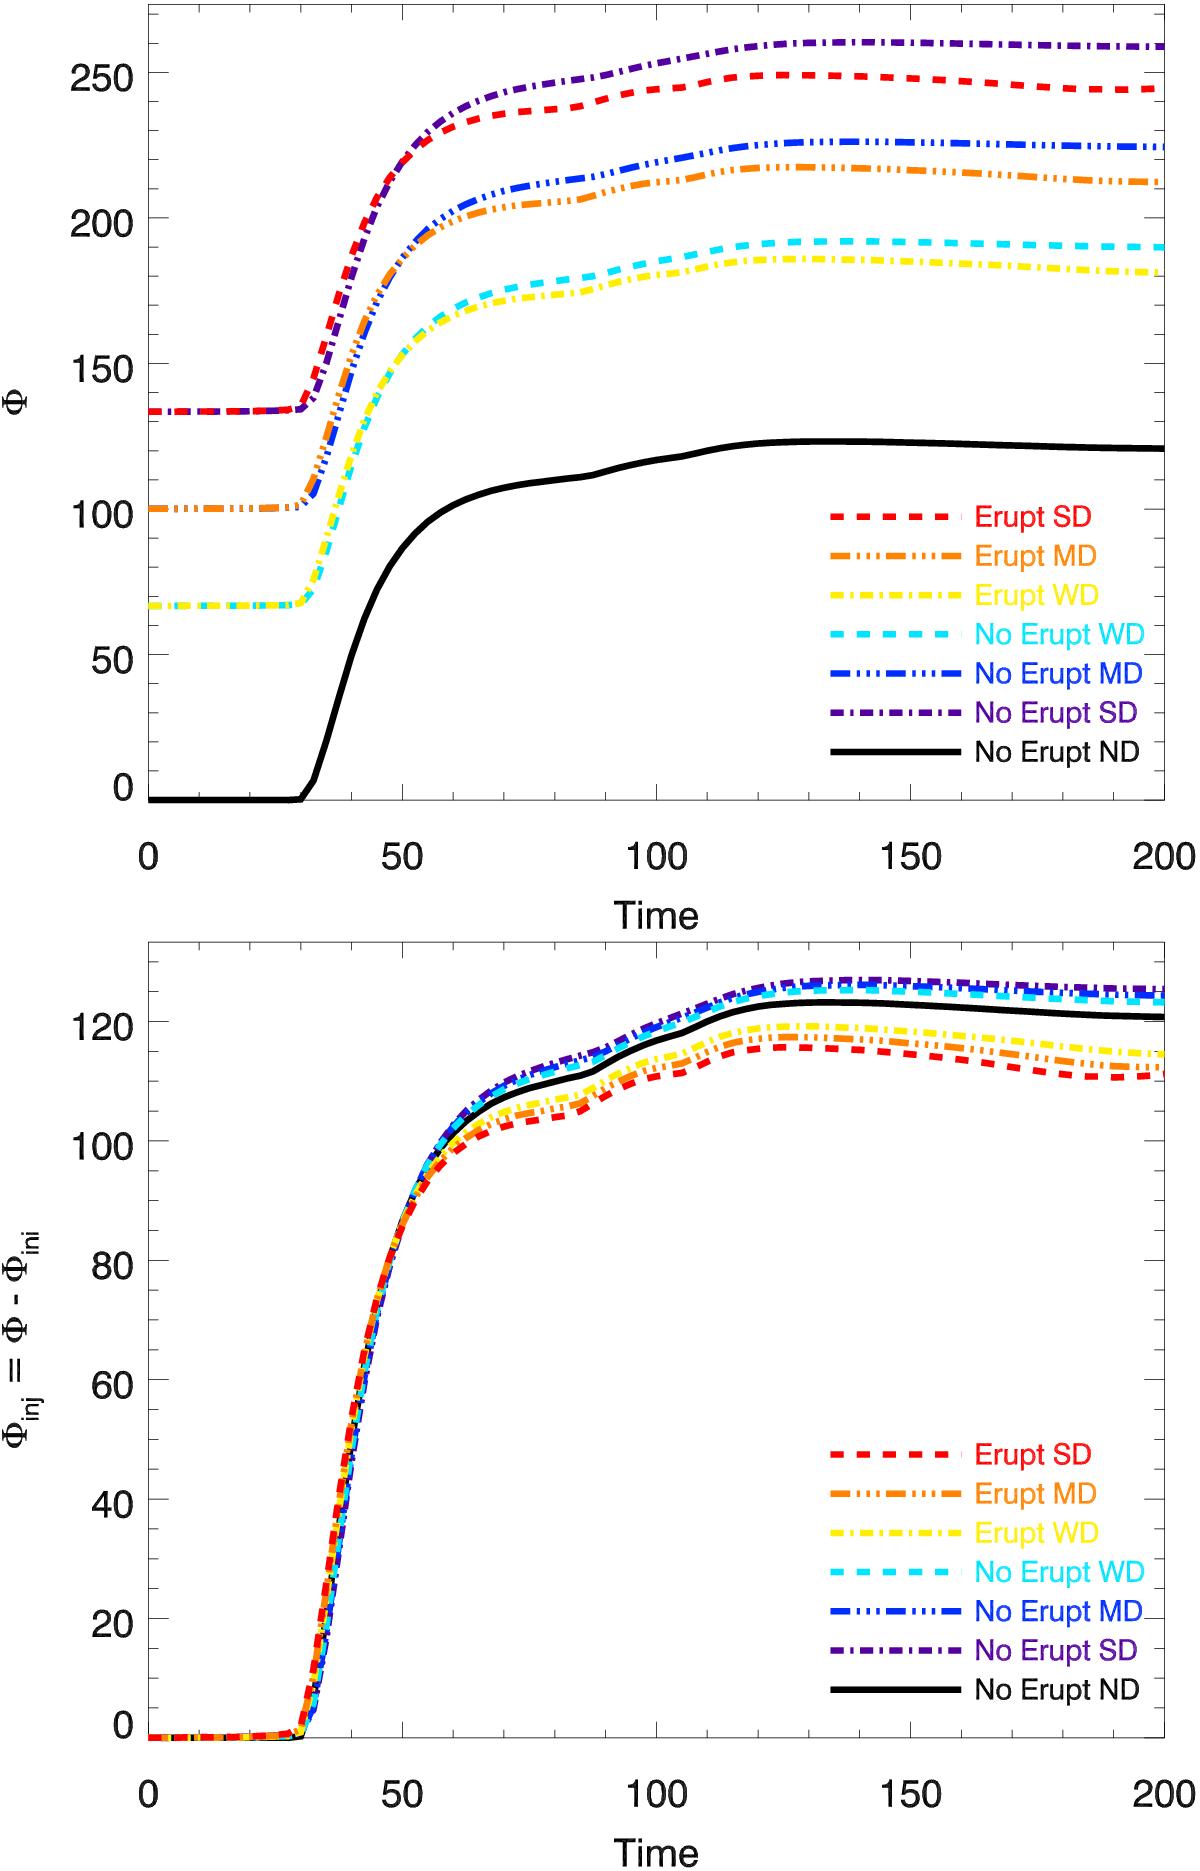
Evolution of the absolute magnetic flux (Φ, top panel) and of the injected magnetic flux (Φinj ≡ Φ−Φ(t = 0), bottom panel) in the system for the 7 parametric simulations. The non-eruptive simulation without surrounding field (No Erupt ND) is plotted with a continuous black line. The non-eruptive simulations with respectively (strong, medium, weak) arcade strength, labelled (No Erupt SD, No Erupt MD, No Erupt WD), are plotted respectively with a (purple dot dashed, blue dot-dot-dot-dashed, cyan dashed) line. The eruptive simulations with respectively (strong, medium, weak) arcade strength, labelled respectively (Erupt SD, Erupt MD, Erupt WD), are plotted respectively with a (red dashed, orange dot-dot-dot-dashed, yellow dot dashed) line.

Current usage metrics show cumulative count of Article Views (full-text article views including HTML views, PDF and ePub downloads, according to the available data) and Abstracts Views on Vision4Press platform.
Data correspond to usage on the plateform after 2015. The current usage metrics is available 48-96 hours after online publication and is updated daily on week days.
Initial download of the metrics may take a while.