Fig. B.1
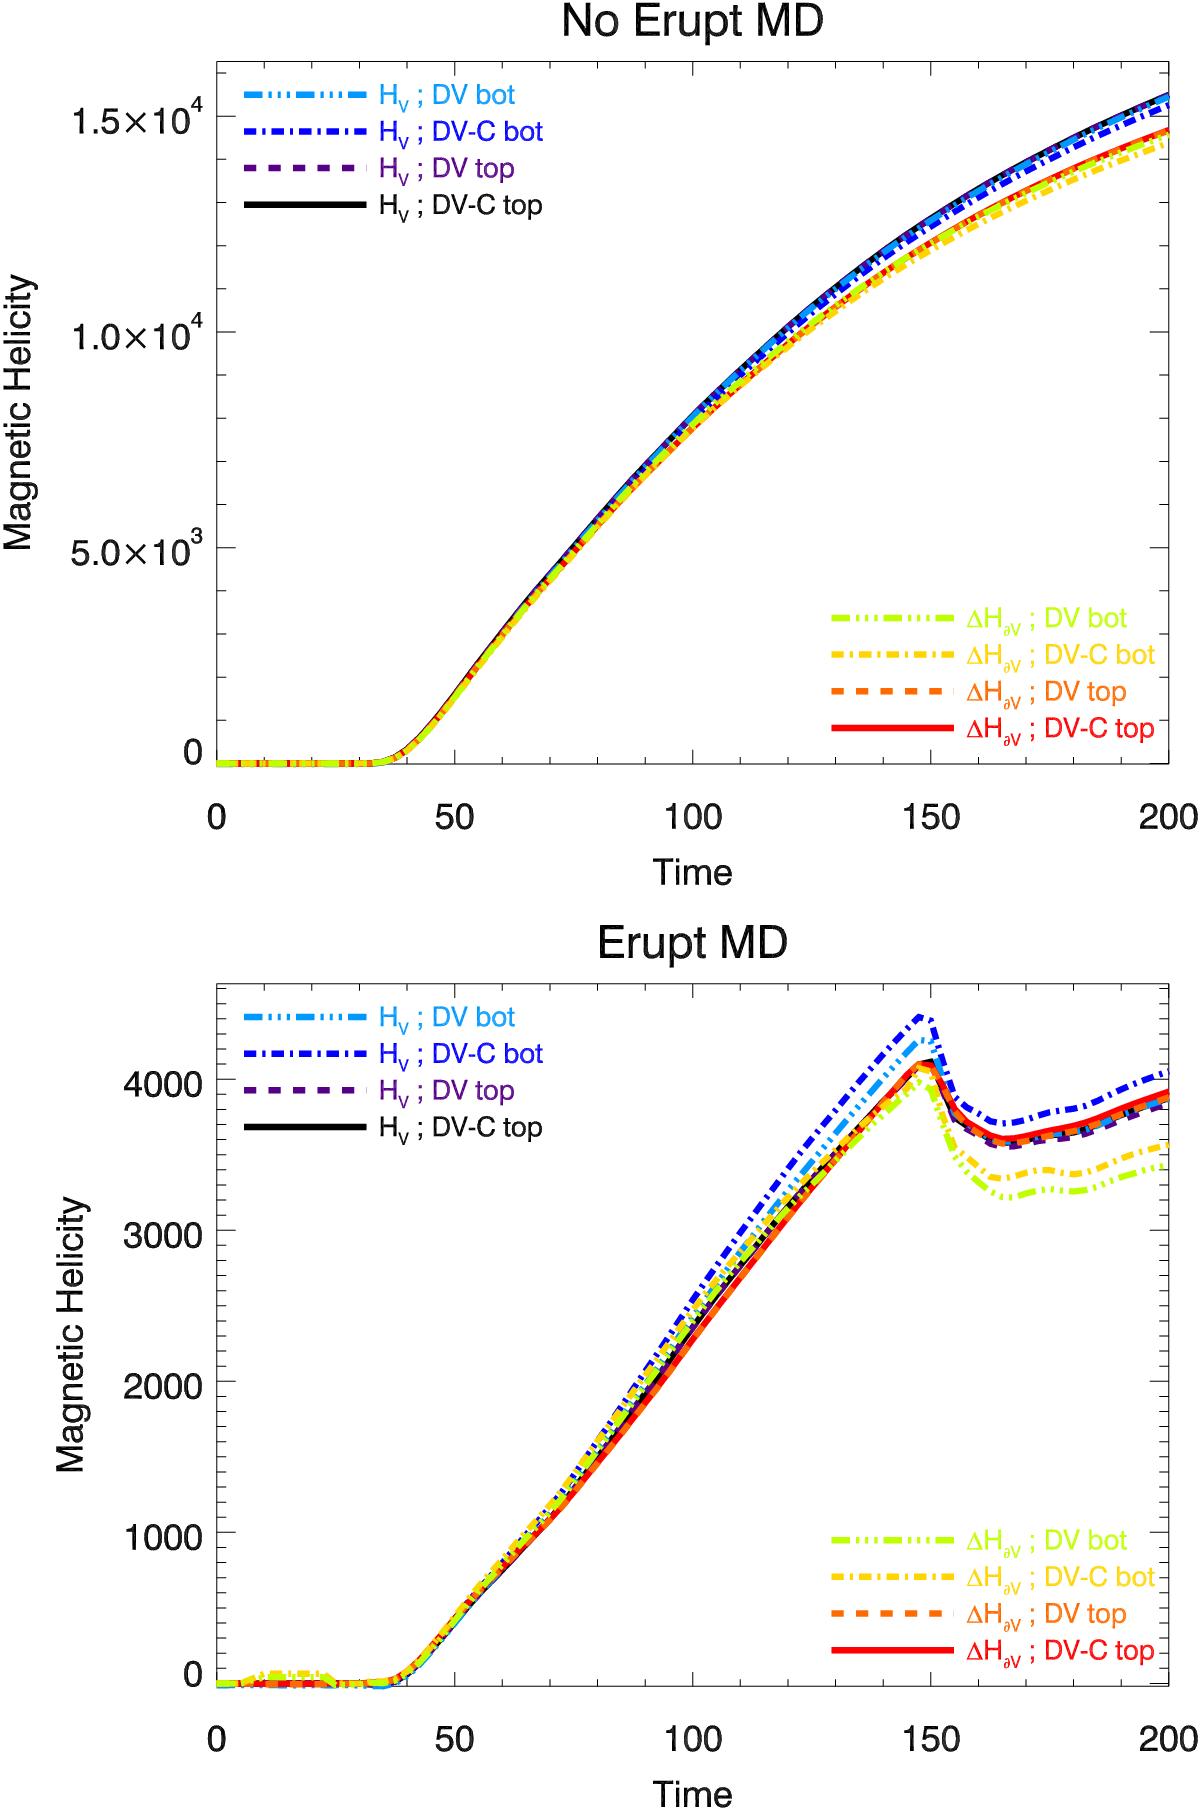
Helicity variation and accumulated flux in the medium arcade simulations for the non-eruptive (top panel) and eruptive (bottom panel) cases. The volume helicity estimations, HV, are plotted in black, purple, blue, and cyan while the time-integrated flux of helicity, ![]() , are plotted in red, orange, yellow, and green. The helicities are computed using the (DV bot, DV top, DV-C bot, DV-C top) gauge sets, corresponding to the (three-dot-dashed, dashed, dot-dashed, continous) curves, respectively.
, are plotted in red, orange, yellow, and green. The helicities are computed using the (DV bot, DV top, DV-C bot, DV-C top) gauge sets, corresponding to the (three-dot-dashed, dashed, dot-dashed, continous) curves, respectively.
Current usage metrics show cumulative count of Article Views (full-text article views including HTML views, PDF and ePub downloads, according to the available data) and Abstracts Views on Vision4Press platform.
Data correspond to usage on the plateform after 2015. The current usage metrics is available 48-96 hours after online publication and is updated daily on week days.
Initial download of the metrics may take a while.