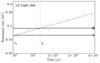
Fig. 4
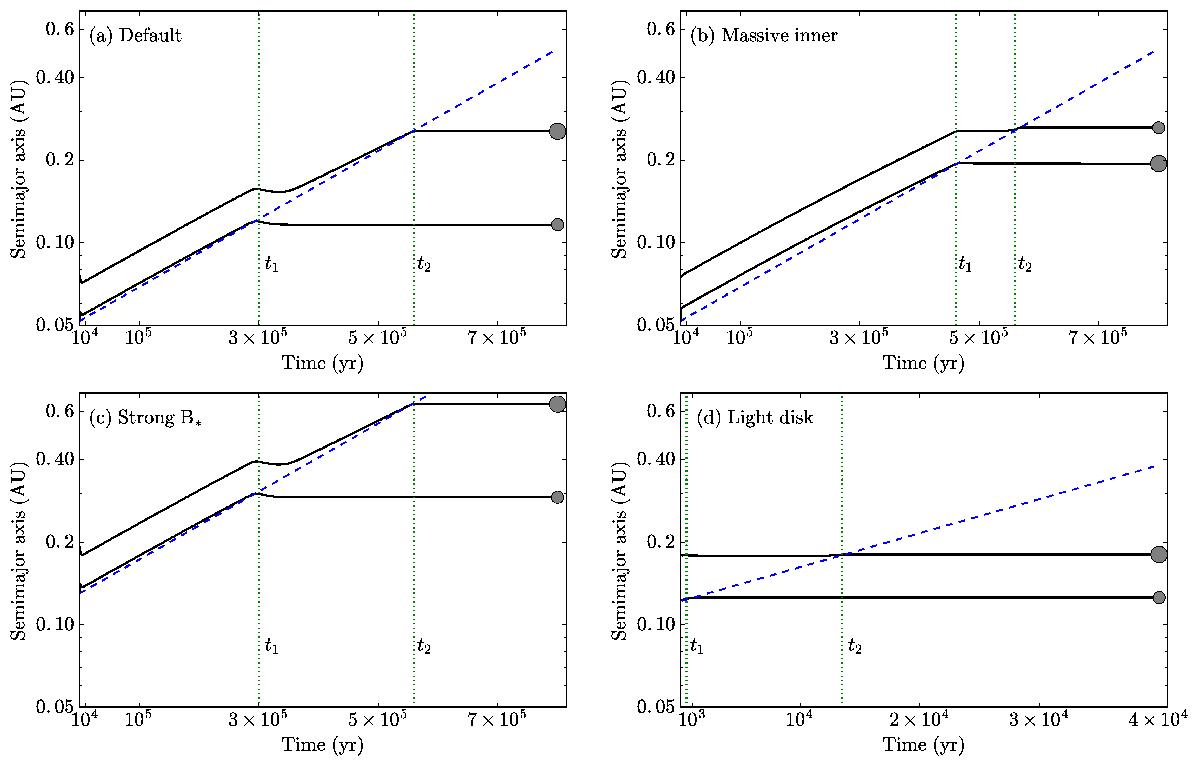
Migration of a planet pair in the gaseous disk. Black lines trace the time evolution of the semi-major axes of the planets and the blue dashed line represents the inner magnetospheric radius rc. The four panels show simulations with a) default parameters; b) massive inner planet; c) strong stellar magnetic field and d) a light disk. Parameters are listed in Table 1. Vertical lines represent the time when the inner (t1) and the outer planet (t2) enter the cavity. We would like to note that the scale of the x-axis of panel d) is different from the others.
Current usage metrics show cumulative count of Article Views (full-text article views including HTML views, PDF and ePub downloads, according to the available data) and Abstracts Views on Vision4Press platform.
Data correspond to usage on the plateform after 2015. The current usage metrics is available 48-96 hours after online publication and is updated daily on week days.
Initial download of the metrics may take a while.