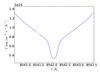
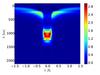
Fig. 3
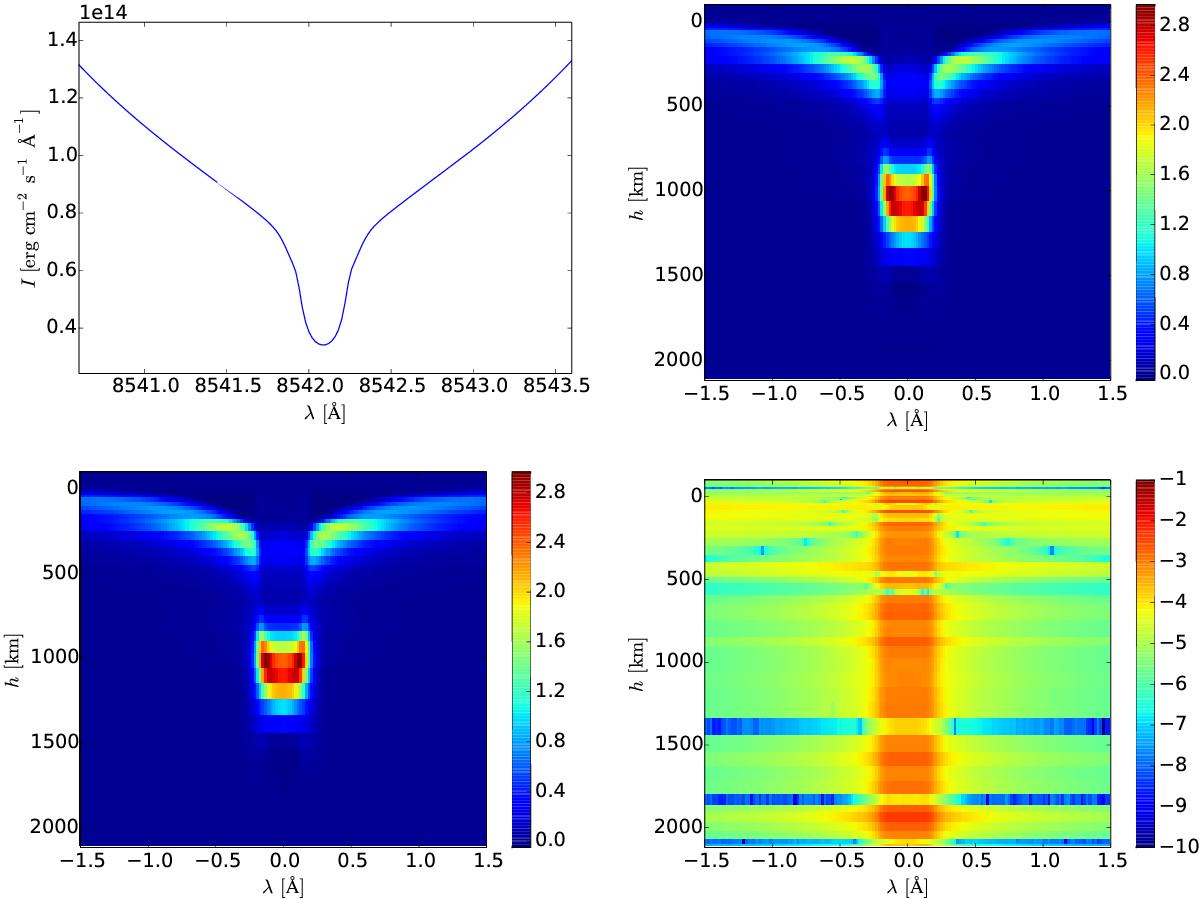
Intensity response functions to temperature for a 8542 Ca line in FALC model atmosphere, normalized with respect to the emergent profile, given in units of 10-4. Top left: emergent line profile; top right: numerical (finite difference) computation of intensity responses; bottom left: responses computed analytically using the method explained in the paper; bottom right: absolute differences between analytical and numerical computations normalized to the maximum response (log scale).

Current usage metrics show cumulative count of Article Views (full-text article views including HTML views, PDF and ePub downloads, according to the available data) and Abstracts Views on Vision4Press platform.
Data correspond to usage on the plateform after 2015. The current usage metrics is available 48-96 hours after online publication and is updated daily on week days.
Initial download of the metrics may take a while.