Fig. 9
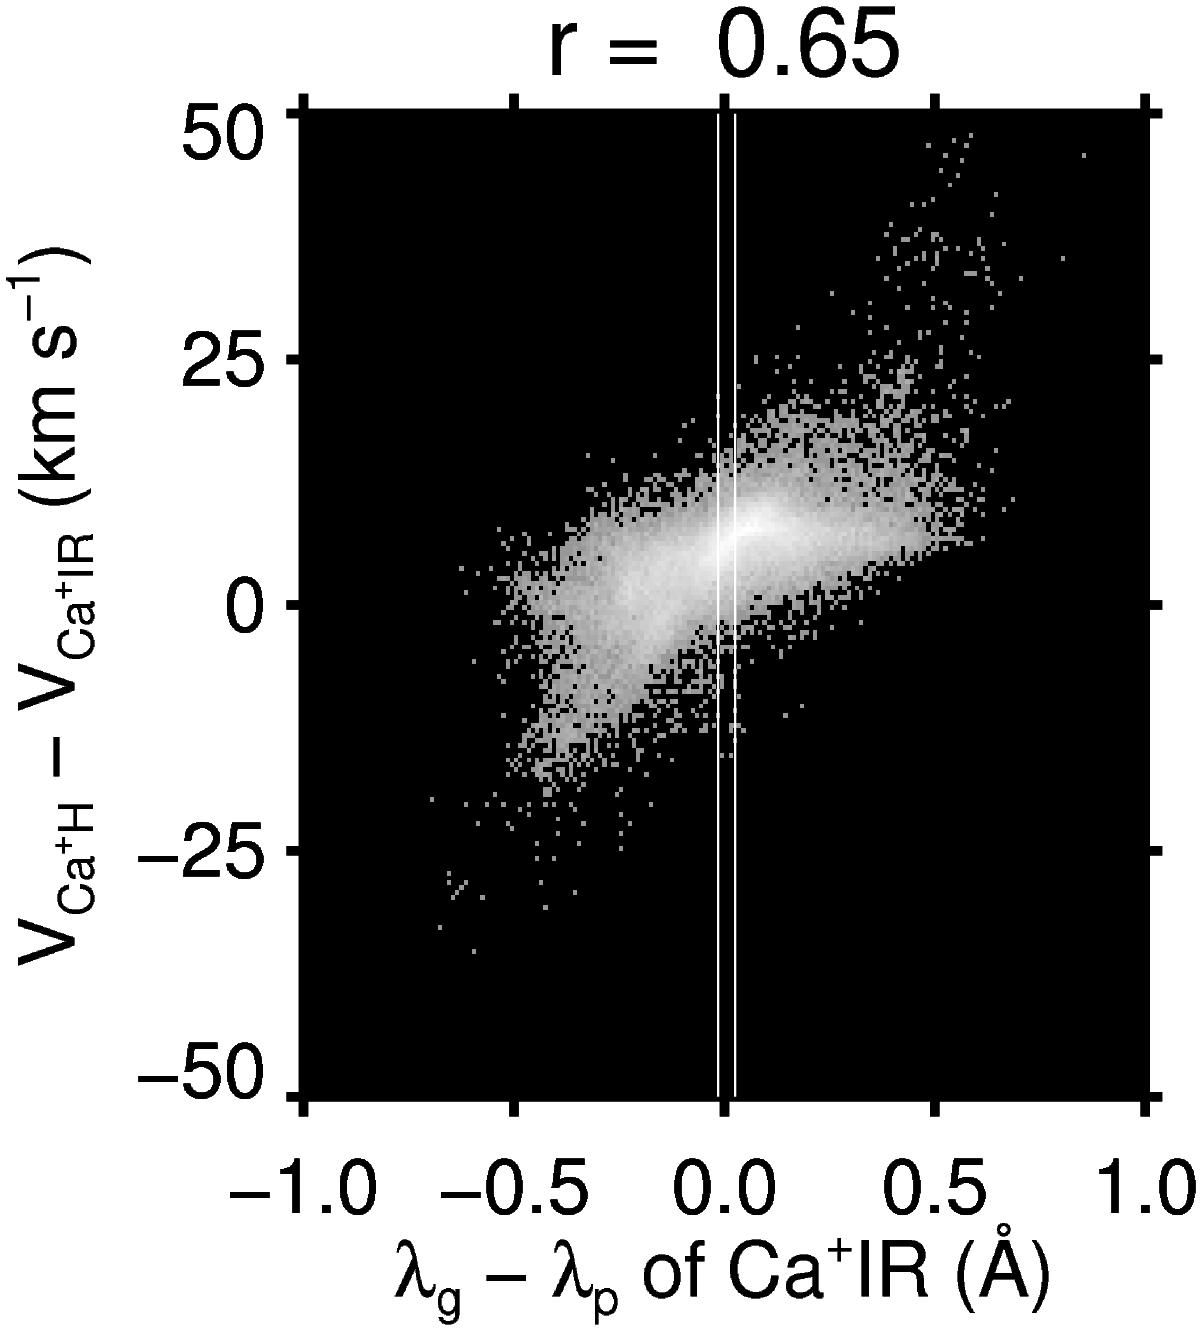
Scatter plot of the differences between the wavelength of the gravity center (λg) and the peak (λp) of Ca+IR vs. the differences of Doppler velocity between Ca+H and Ca+IR in the pixels that satisfy all the conditions described in Sect. 3. The linear Pearson correlation coefficient, r, is 0.65. The white vertical lines indicate the threshold of λg−λp of Ca+IR to exclude the highly asymmetric profiles to give the absolute value of the linear Pearson correlation coefficient of all combinations of the four lines to be less than 0.3.
Current usage metrics show cumulative count of Article Views (full-text article views including HTML views, PDF and ePub downloads, according to the available data) and Abstracts Views on Vision4Press platform.
Data correspond to usage on the plateform after 2015. The current usage metrics is available 48-96 hours after online publication and is updated daily on week days.
Initial download of the metrics may take a while.