Fig. 6
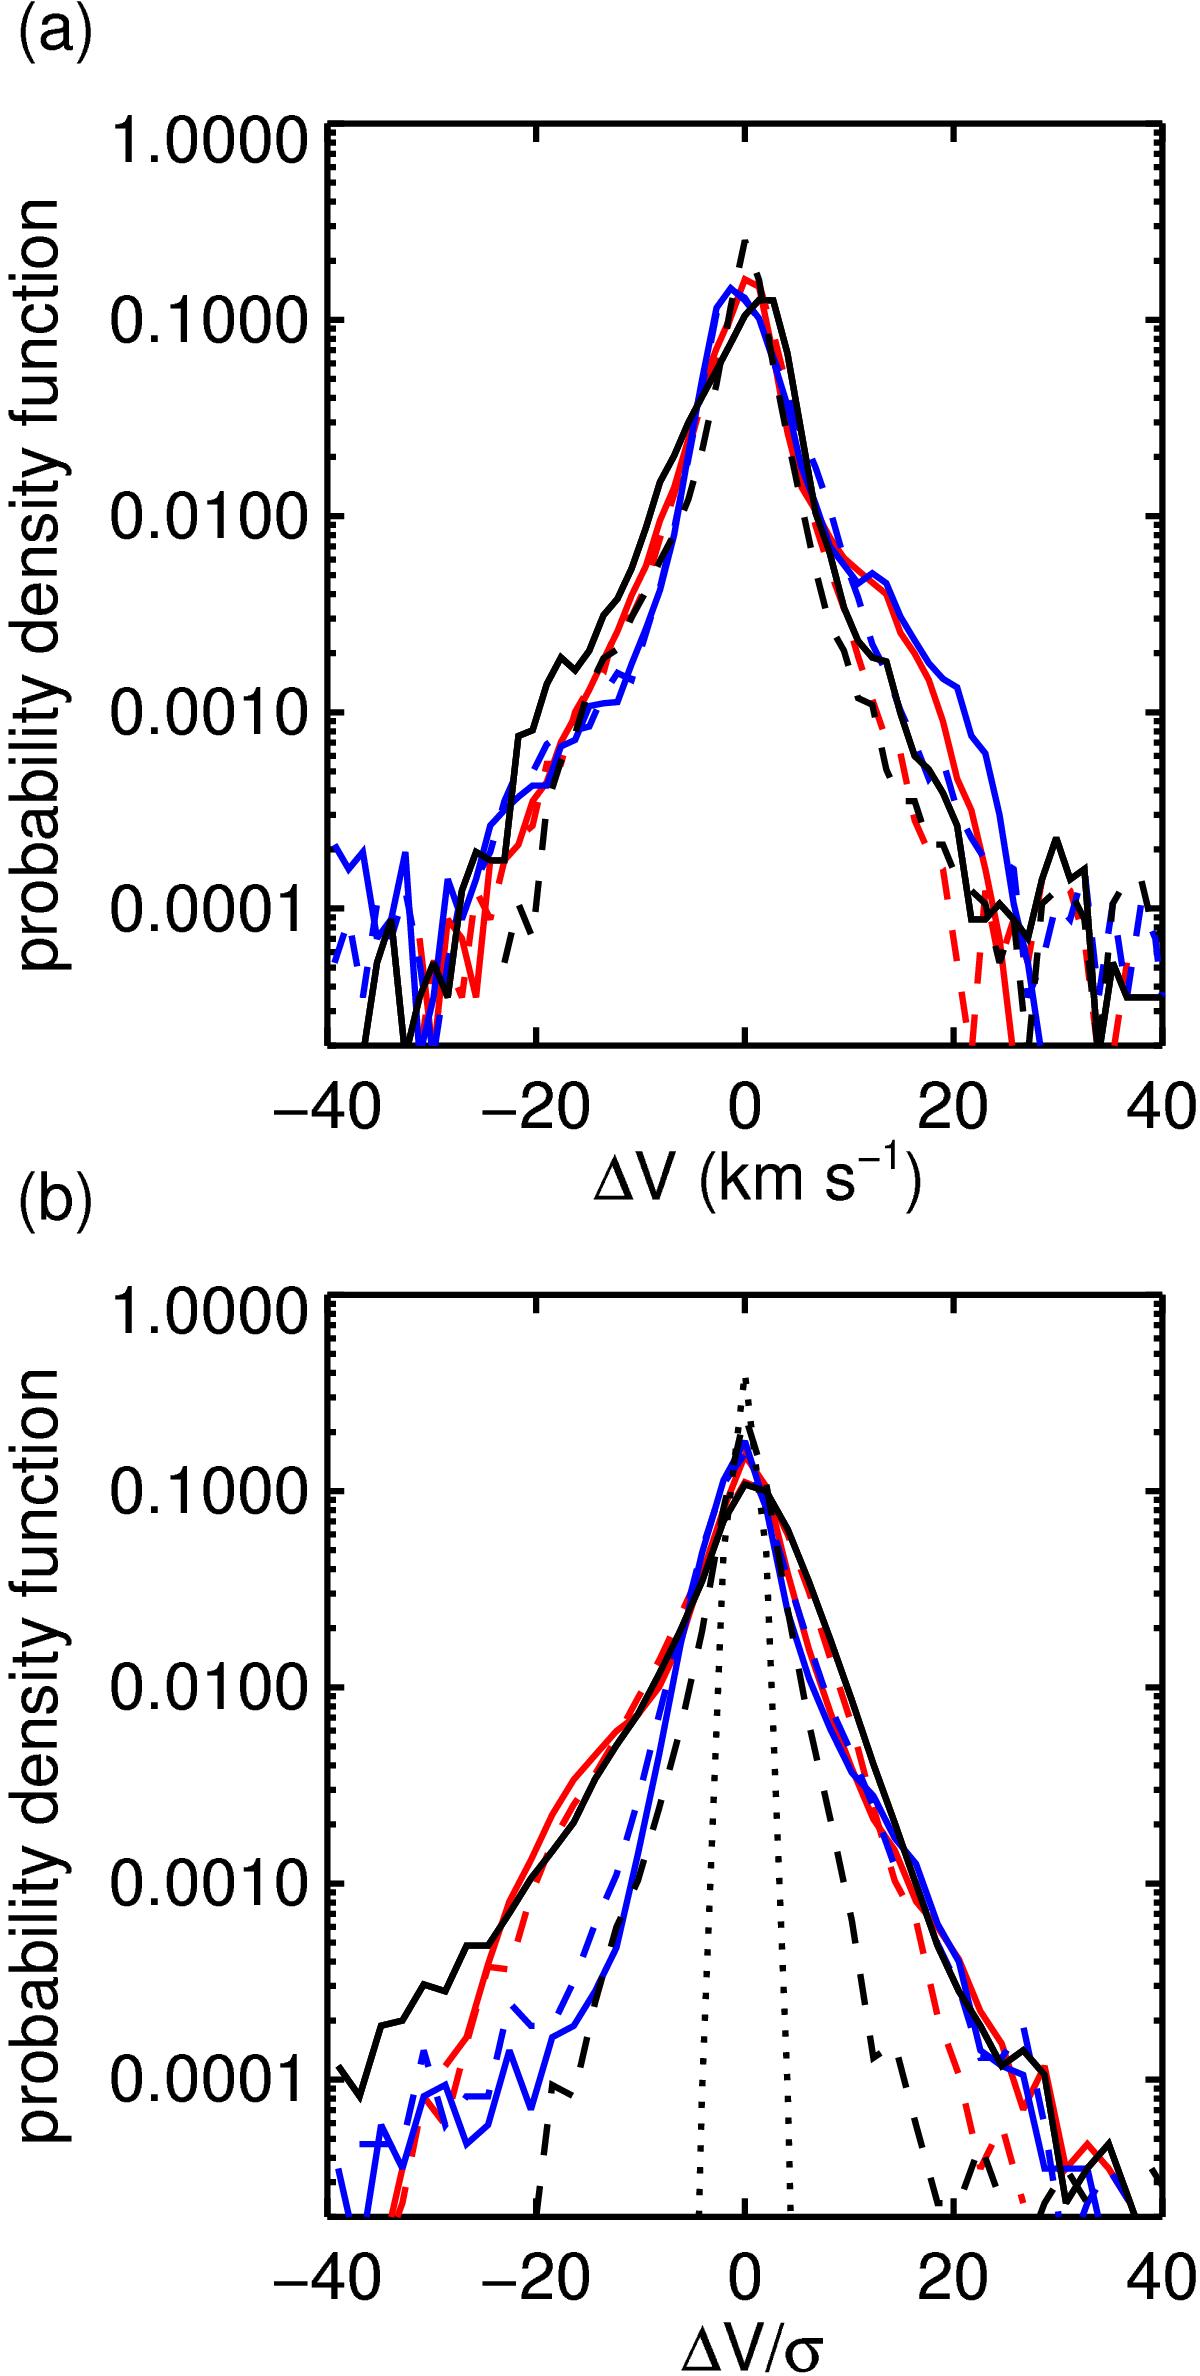
Probability density functions of differences between the Doppler velocity of Ca+H and Hϵ (red solid line), Ca+H and Hγ (red dashed line), Ca+IR and Hϵ (blue solid line), Ca+IR and Hγ (blue dashed line), Ca+H and Ca+IR (black solid line), and Hϵ and Hγ (black dashed line). For the functions b), the velocity differences were normalized to the measurement errors, σ. The black dotted line indicates the normal distribution with a standard deviation of 1.
Current usage metrics show cumulative count of Article Views (full-text article views including HTML views, PDF and ePub downloads, according to the available data) and Abstracts Views on Vision4Press platform.
Data correspond to usage on the plateform after 2015. The current usage metrics is available 48-96 hours after online publication and is updated daily on week days.
Initial download of the metrics may take a while.