Free Access
Fig. 3
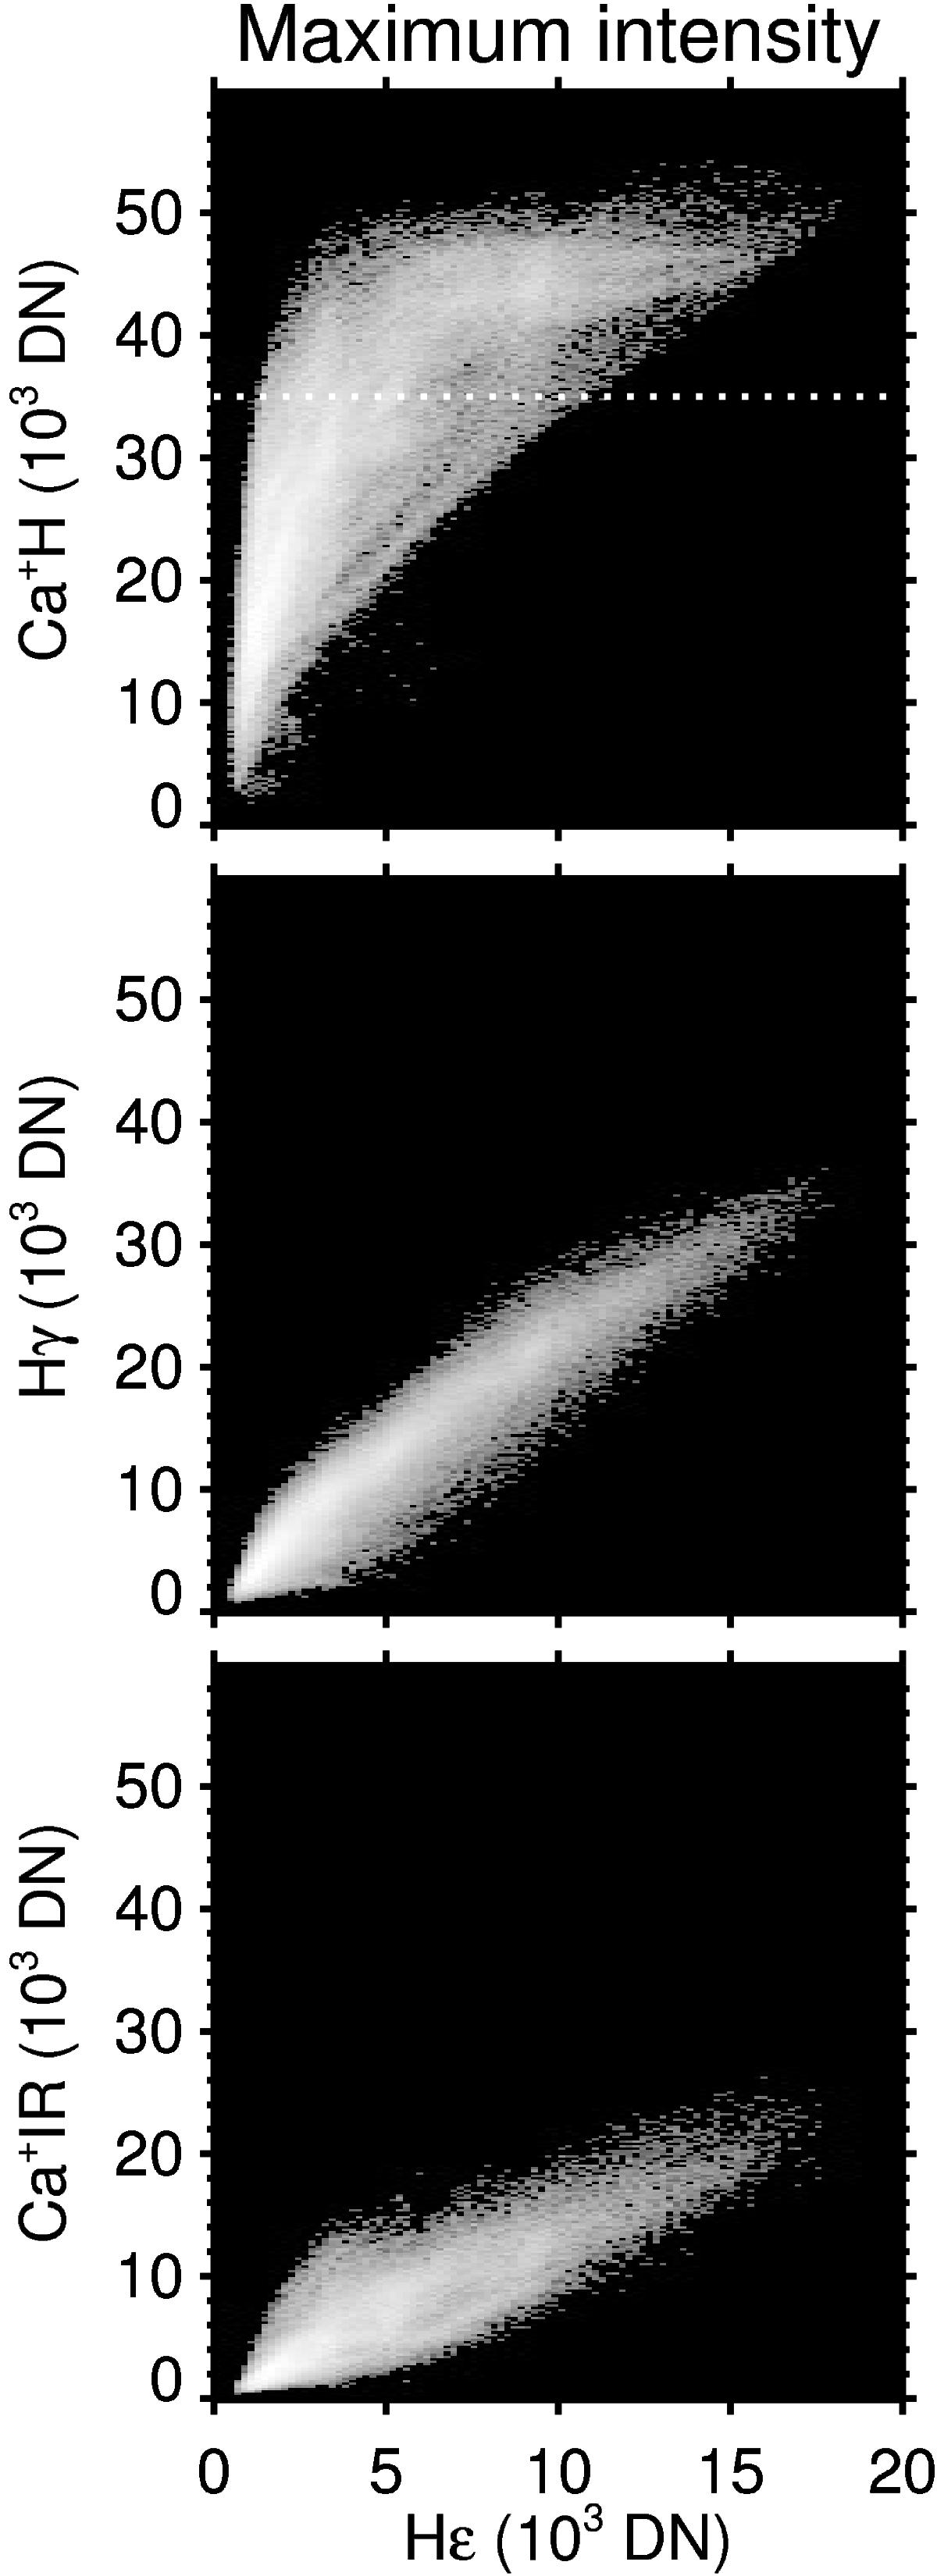
Maximum intensity of Ca+H vs. Hϵ, Hγ vs. Hϵ, and Ca+IR vs. Hϵ. The white dotted line indicates a threshold in the maximum intensity of Ca+H to determine the Ca+H intensities that are emitted by optically-thin plasma.
Current usage metrics show cumulative count of Article Views (full-text article views including HTML views, PDF and ePub downloads, according to the available data) and Abstracts Views on Vision4Press platform.
Data correspond to usage on the plateform after 2015. The current usage metrics is available 48-96 hours after online publication and is updated daily on week days.
Initial download of the metrics may take a while.