Fig. 2
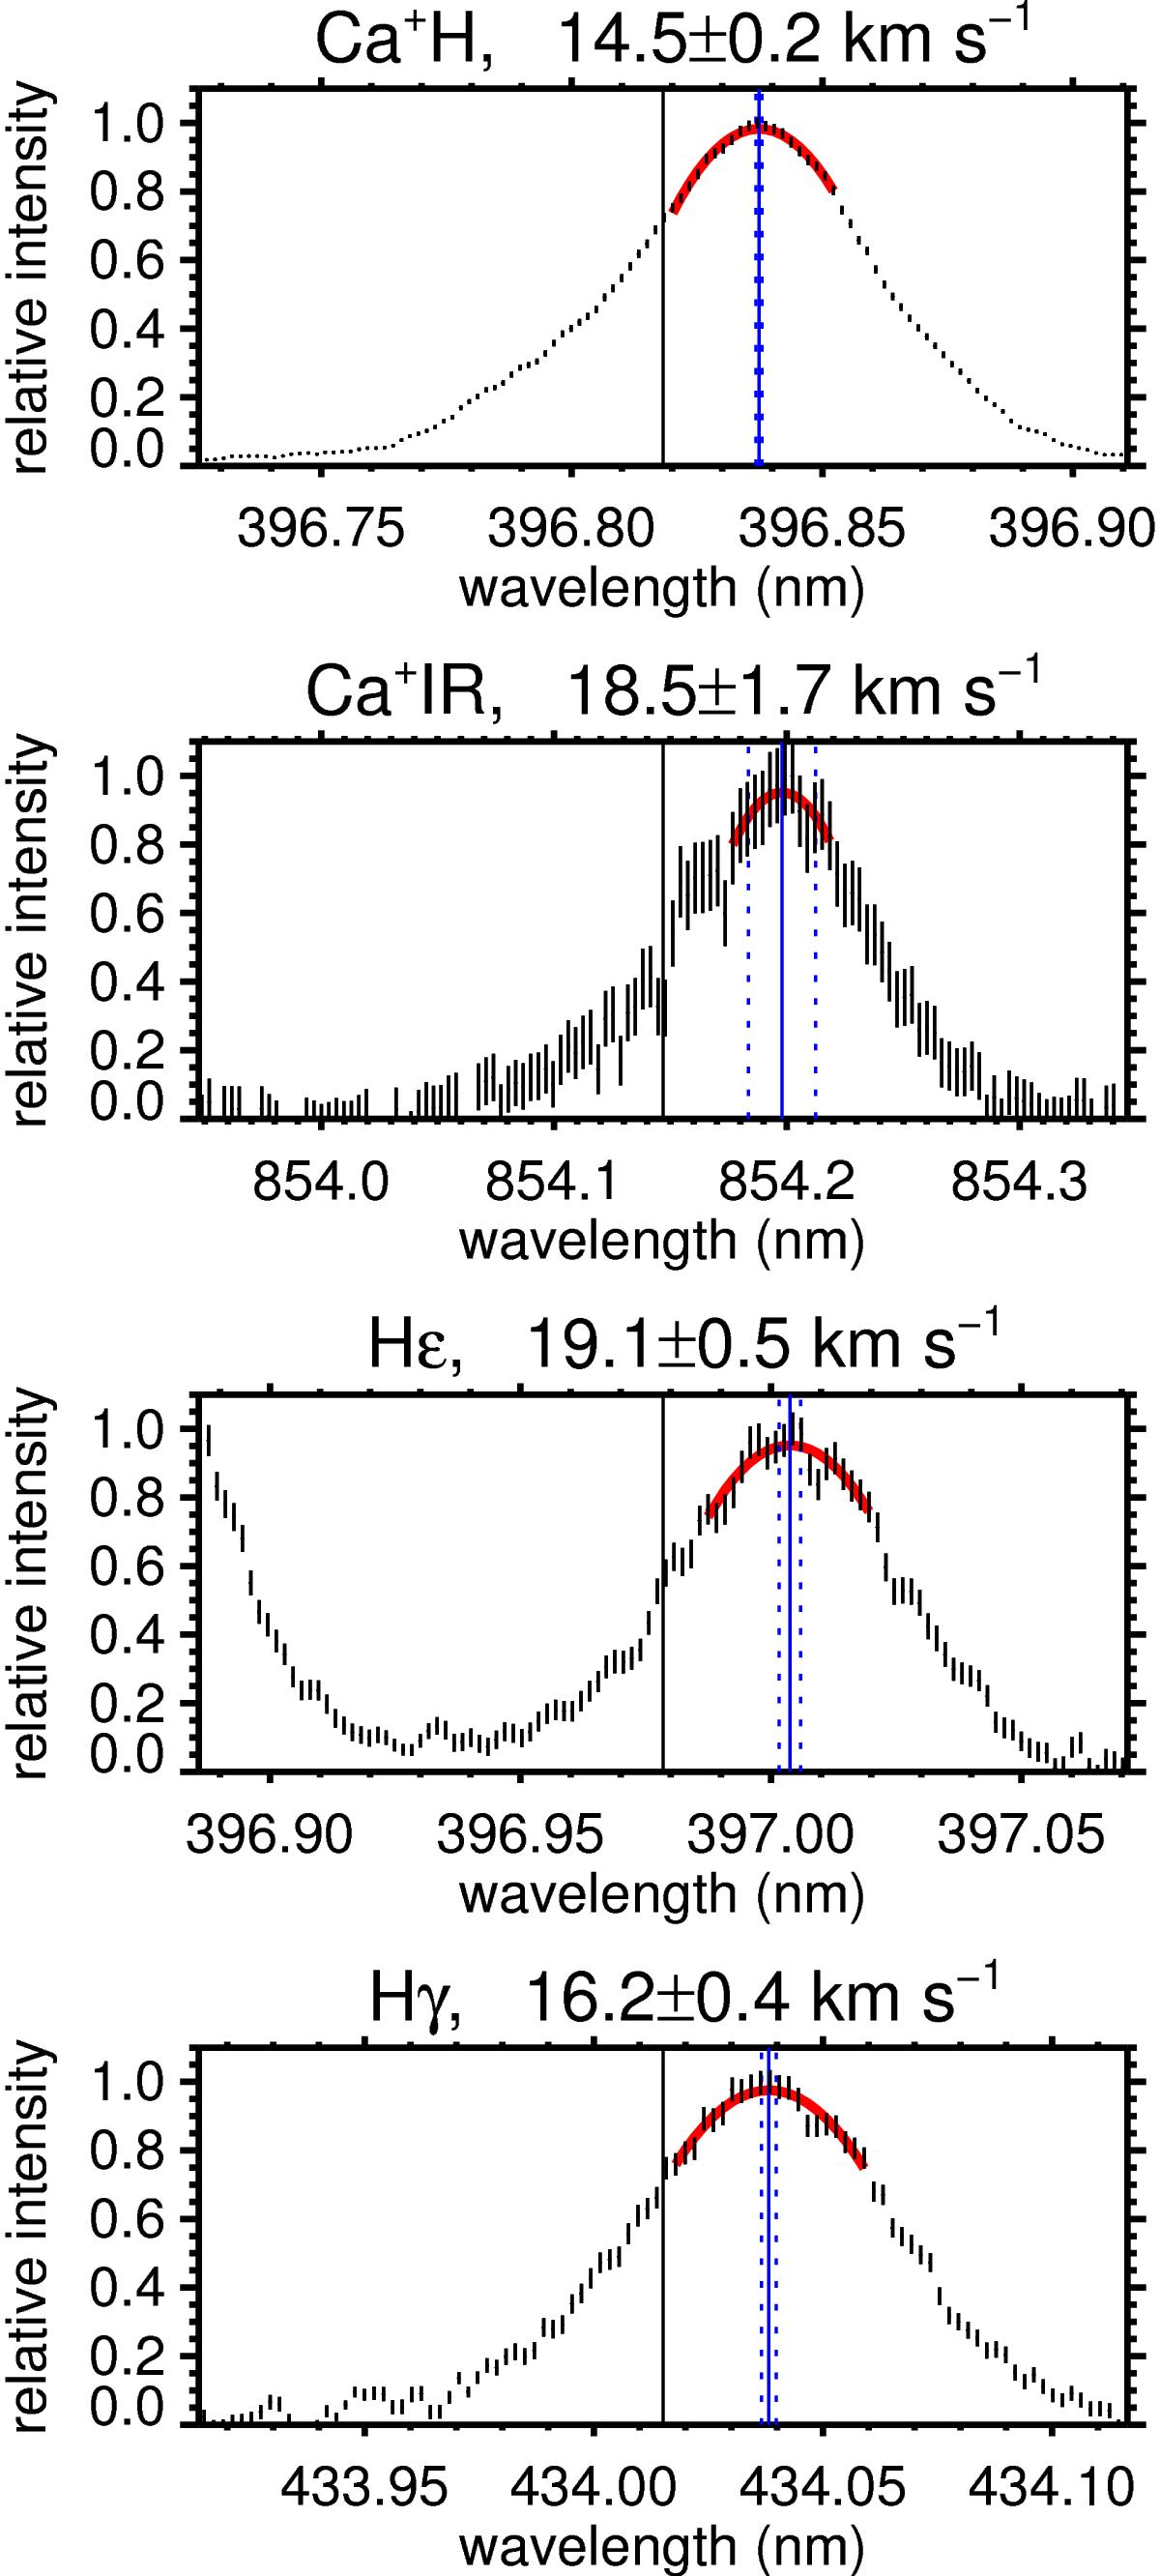
Example of the observed profiles and fits with a parabola. Black symbols indicate the observed profiles in Ca+H, Ca+IR, Hϵ, and Hγ normalized by the maximum intensity of each profile. The wavelength position of each peak (blue solid lines) is determined from fitting (red lines) with a parabola using interval at which the intensity is larger than 75% of the peak intensity. The inferred Doppler velocities of Ca+H, Ca+IR, Hϵ, and Hγ are 14.5 ± 0.2 km s-1, 18.5 ± 1.7 km s-1, 19.1 ± 0.5 km s-1, and 16.2 ± 0.4 km s-1, respectively. The measurement error is indicated in each title for the 1-sigma uncertainty, and in each plot as the blue dotted lines for the 3-sigma uncertainty. The minimum and maximum wavelength ranges displayed in the individual panels are −70 and + 70 km s-1, respectively. The black vertical solid lines denote the wavelengths where the Doppler velocities are equal to zero.
Current usage metrics show cumulative count of Article Views (full-text article views including HTML views, PDF and ePub downloads, according to the available data) and Abstracts Views on Vision4Press platform.
Data correspond to usage on the plateform after 2015. The current usage metrics is available 48-96 hours after online publication and is updated daily on week days.
Initial download of the metrics may take a while.