Fig. 10
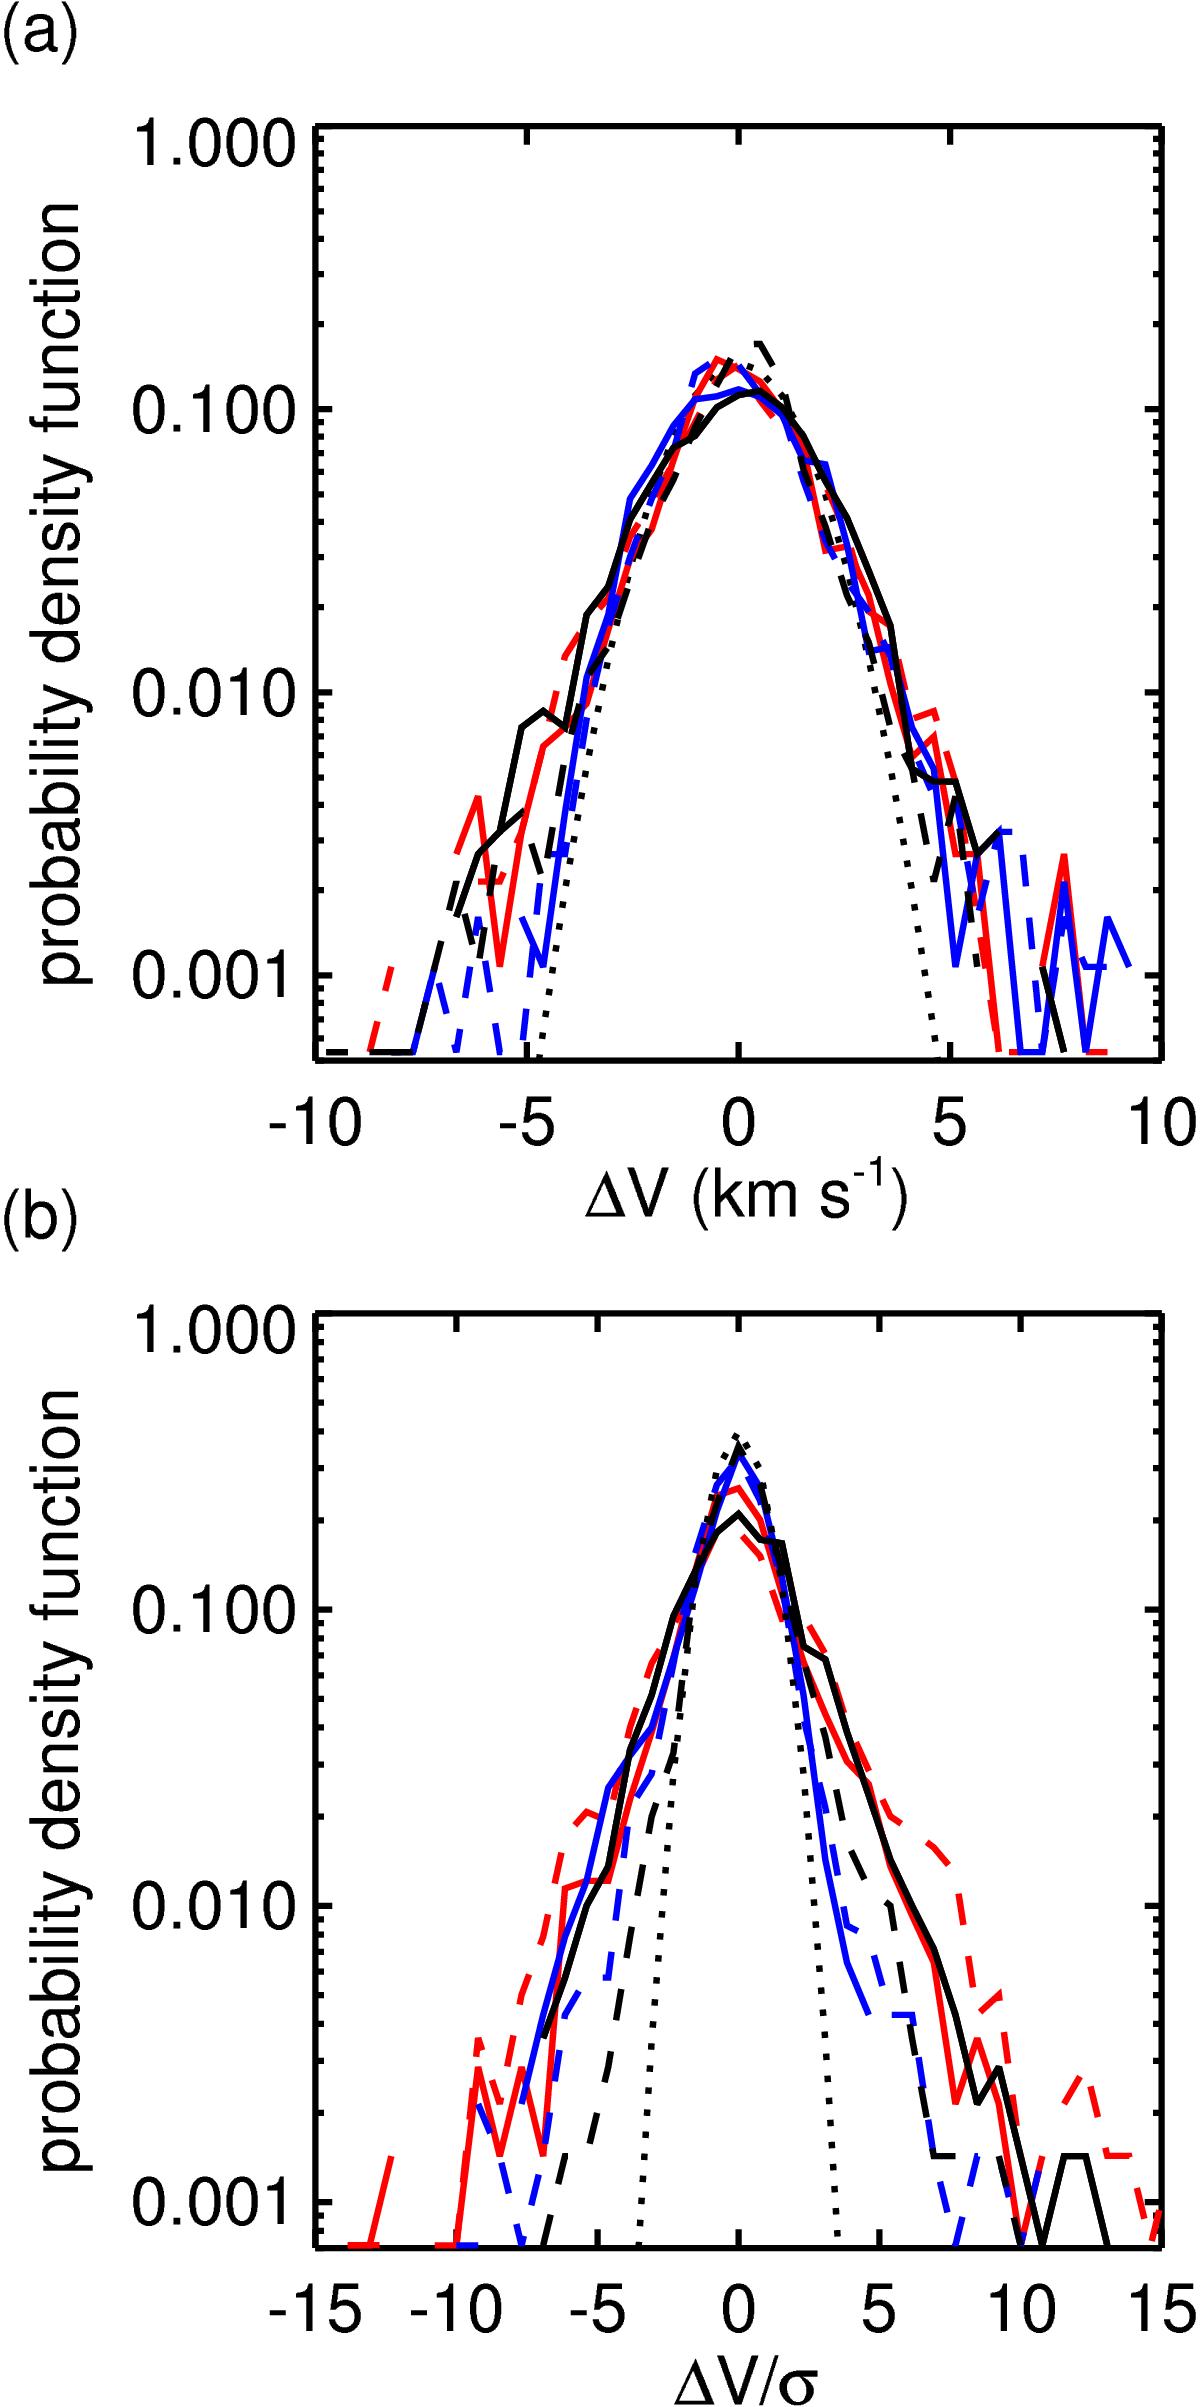
As Fig. 6, but obtained from spectral profiles, which do not have large asymmetry of the line profile or two clear peaks within the wavelength interval for the parabola fitting. For the functions a), the black dotted line indicates a Gaussian distribution with a standard deviation of 1.4 km s-1. We note that the x-axes and the y-axes over smaller ranges than those of Fig. 6.
Current usage metrics show cumulative count of Article Views (full-text article views including HTML views, PDF and ePub downloads, according to the available data) and Abstracts Views on Vision4Press platform.
Data correspond to usage on the plateform after 2015. The current usage metrics is available 48-96 hours after online publication and is updated daily on week days.
Initial download of the metrics may take a while.