Fig. 8
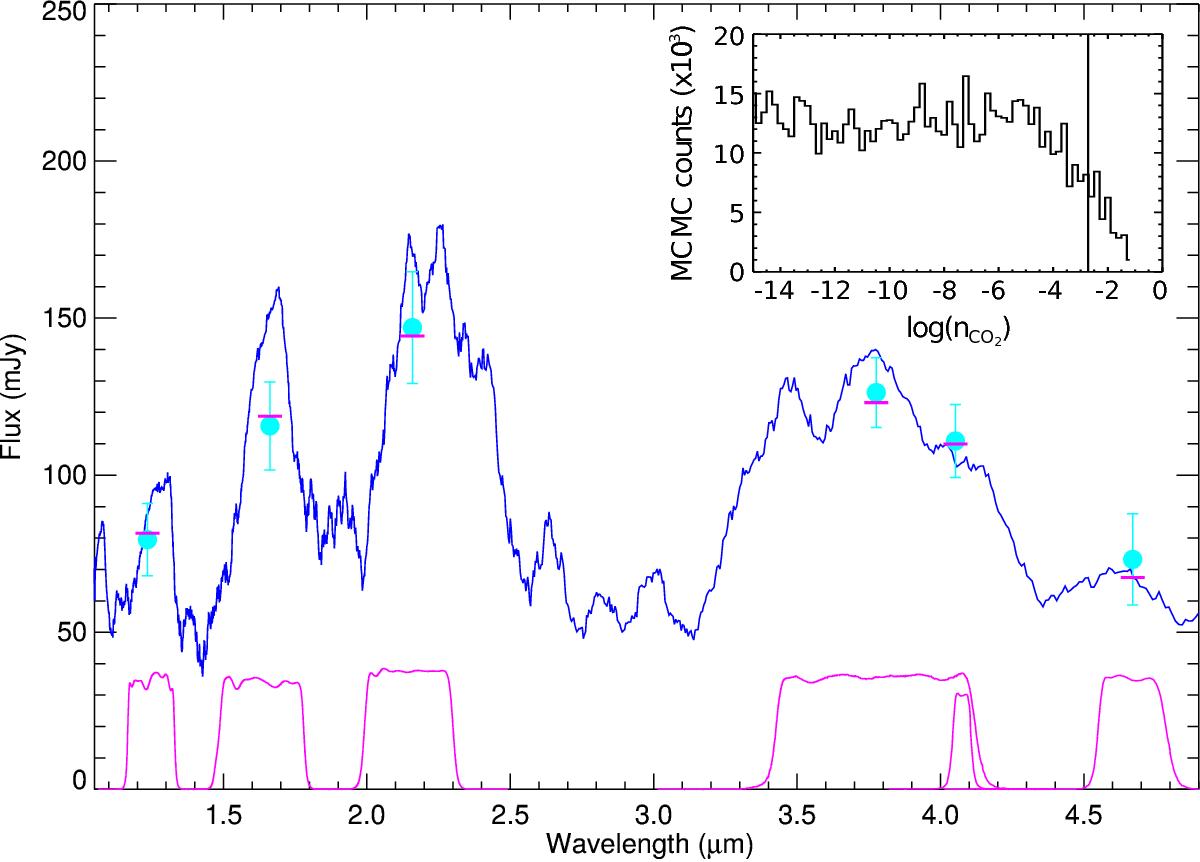
Best fit found by the MCMC retrieval run for the photometry of ROXS 42B b (χ2 = 0.35). The observed data is indicated by cyan points with error bars. The blue curve shows a smoothed version of the retrieval emission model and the magenta points represent the model integrated over the transmission function of the photometric bands (magenta curves at bottom) to match the photometry. We note that this is not necessarily the best fit (according to χ2) since the MCMC parameter states make random jumps, but just the best fit encountered by the Markov chain. The inset shows the histogram of the CO2 molecule number fraction throughout the MCMC run. Values of log (nCO2) above −1 are not permitted by the fitting routine; 95% of the values are below −2.7 establishing the upper limit we adopt.
Current usage metrics show cumulative count of Article Views (full-text article views including HTML views, PDF and ePub downloads, according to the available data) and Abstracts Views on Vision4Press platform.
Data correspond to usage on the plateform after 2015. The current usage metrics is available 48-96 hours after online publication and is updated daily on week days.
Initial download of the metrics may take a while.