Fig. 8
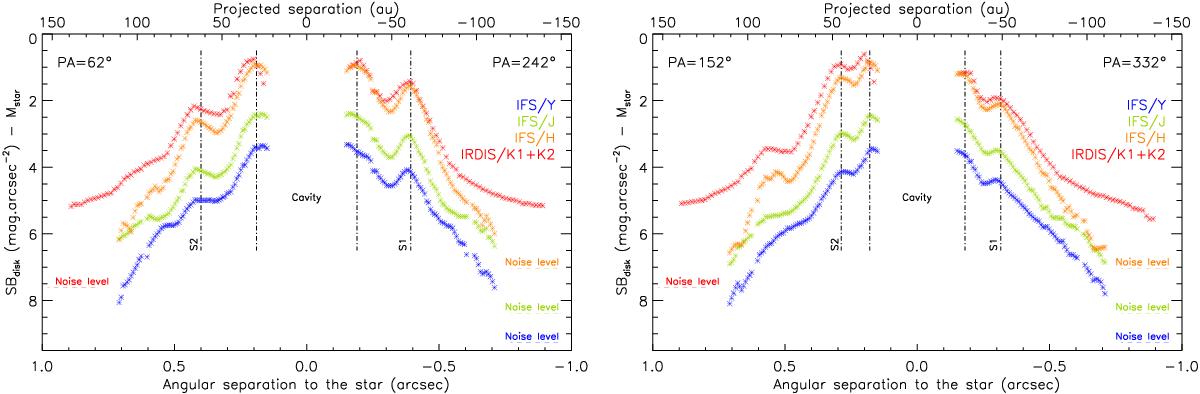
Radial surface brightness profiles along the major (left panel) and minor (right panel) axes of the disk for the RDI IFS and IRDIS images. The profiles were corrected for the spectral dependency of the stellar flux (the label Mstar on the y-axis refers to the stellar magnitude). The noise levels at 1σ are indicated as dashed horizontal lines (see text).
Current usage metrics show cumulative count of Article Views (full-text article views including HTML views, PDF and ePub downloads, according to the available data) and Abstracts Views on Vision4Press platform.
Data correspond to usage on the plateform after 2015. The current usage metrics is available 48-96 hours after online publication and is updated daily on week days.
Initial download of the metrics may take a while.