Fig. 12
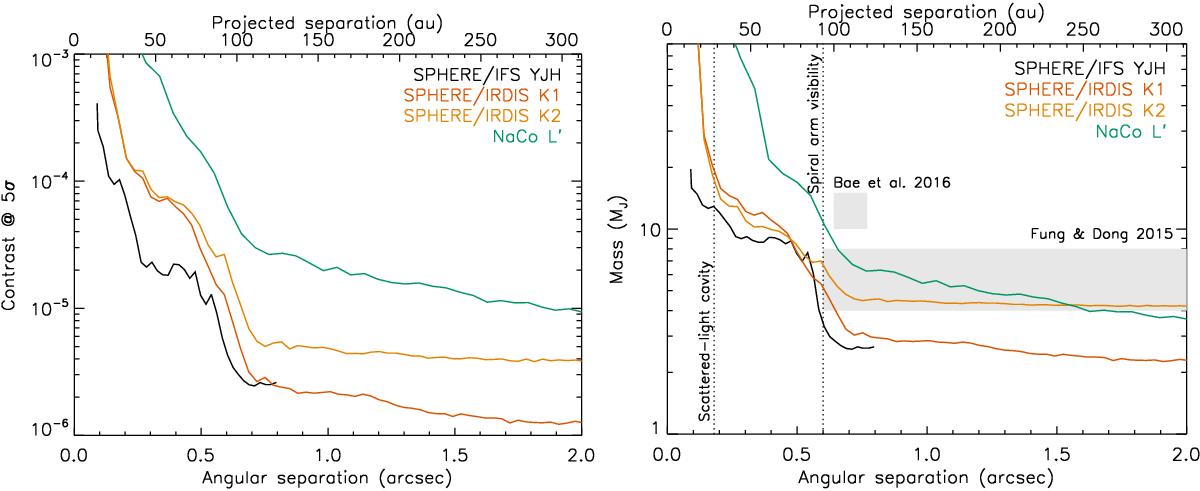
5σ detection limits in contrast with respect to the star (left) and in planet mass (right). For the conversion of the SPHERE contrast limits, we used the atmospheric and evolutionary models of Baraffe et al. (2015, and 2003), while for the NaCo contrast limits, we assumed the models of Allard et al. (2012) and Baraffe et al. (2003). The locations of the outer edge of the scattered-light cavity and the outer visibility radius of the spiral arms are also shown (Stolker et al. 2016). Greyed areas indicate theoretical planet predictions from Fung & Dong (2015) and Bae et al. (2016).
Current usage metrics show cumulative count of Article Views (full-text article views including HTML views, PDF and ePub downloads, according to the available data) and Abstracts Views on Vision4Press platform.
Data correspond to usage on the plateform after 2015. The current usage metrics is available 48-96 hours after online publication and is updated daily on week days.
Initial download of the metrics may take a while.