Fig. 1
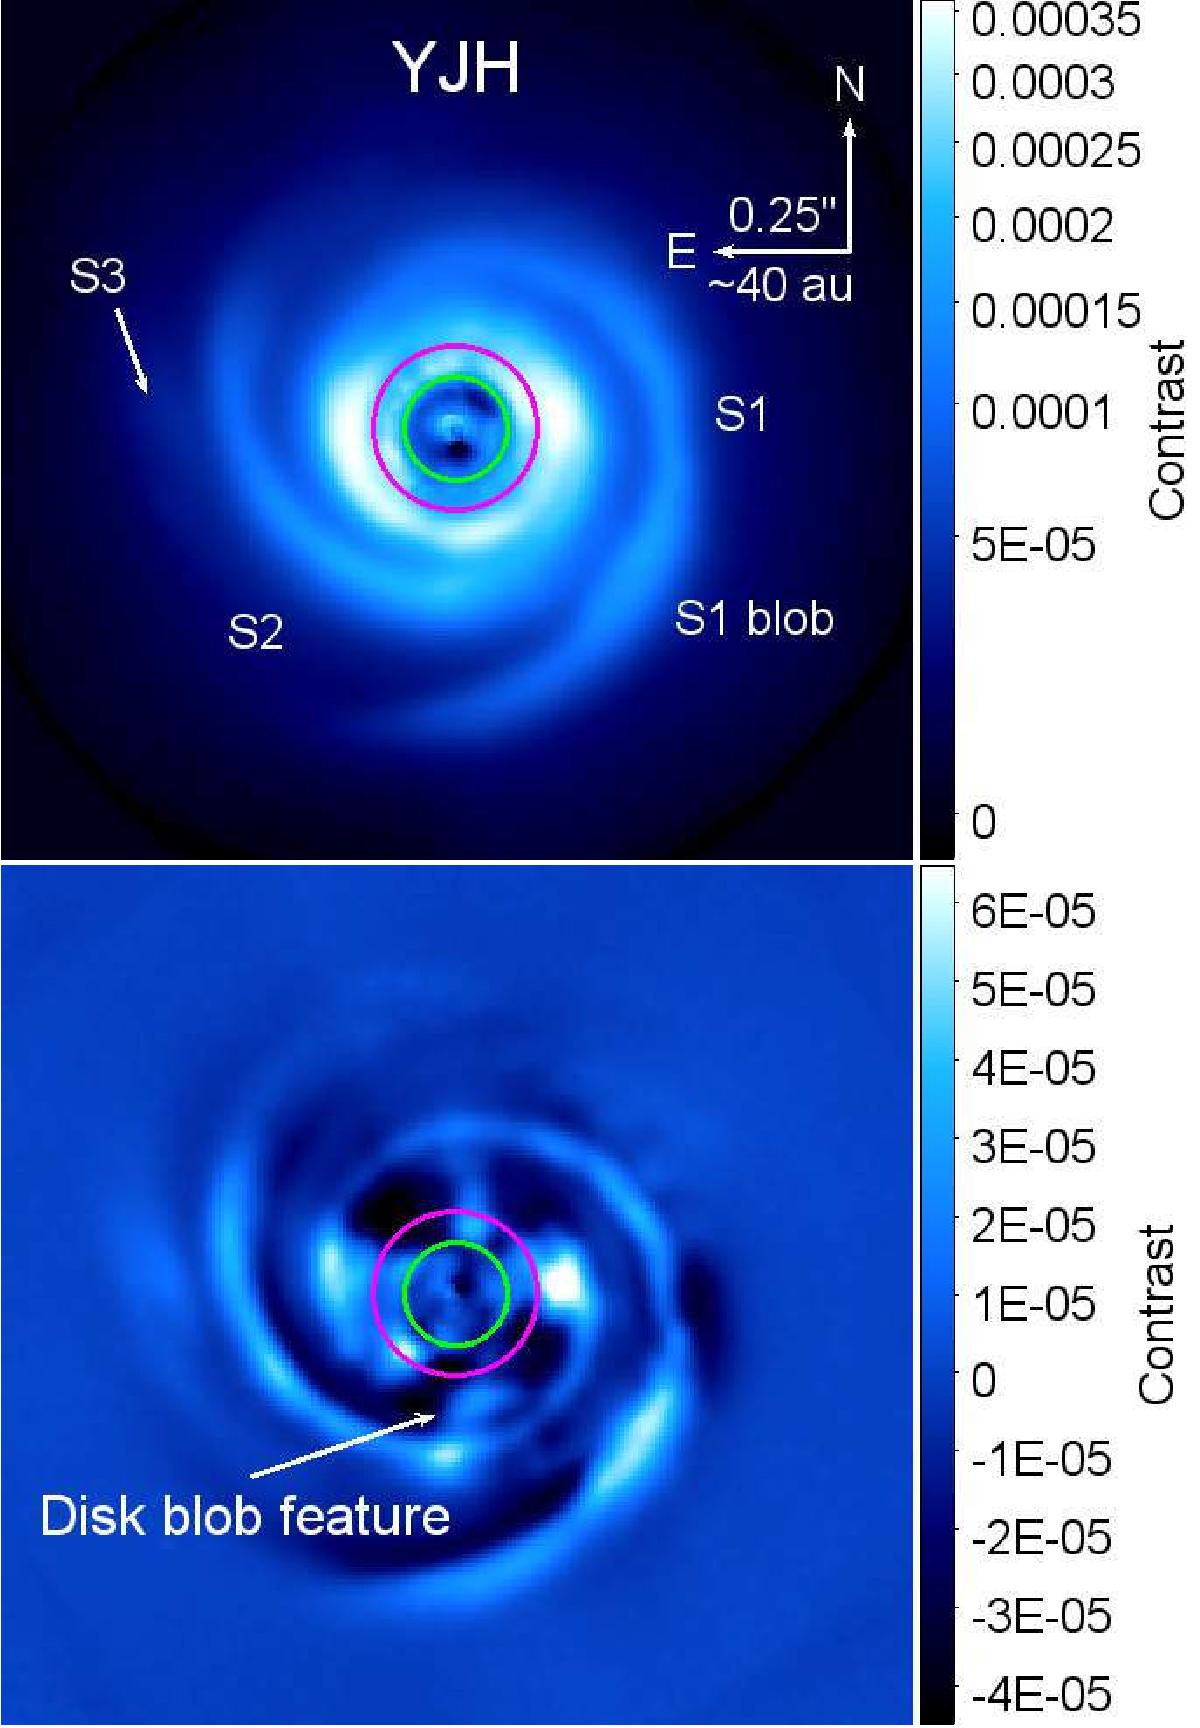
SPHERE/IFS images in the YJH bands normalized to the unsaturated non-coronagraphic PSF peak after RDI (top panel) and classical ADI (bottom panel). The intensity scale is square root for the RDI image and linear for the ADI image. The green and magenta circles indicate the diameter of the coronagraph mask and regions dominated by the stellar residuals (diameter ≃0.27′′), respectively (see text).
Current usage metrics show cumulative count of Article Views (full-text article views including HTML views, PDF and ePub downloads, according to the available data) and Abstracts Views on Vision4Press platform.
Data correspond to usage on the plateform after 2015. The current usage metrics is available 48-96 hours after online publication and is updated daily on week days.
Initial download of the metrics may take a while.