Fig. 1
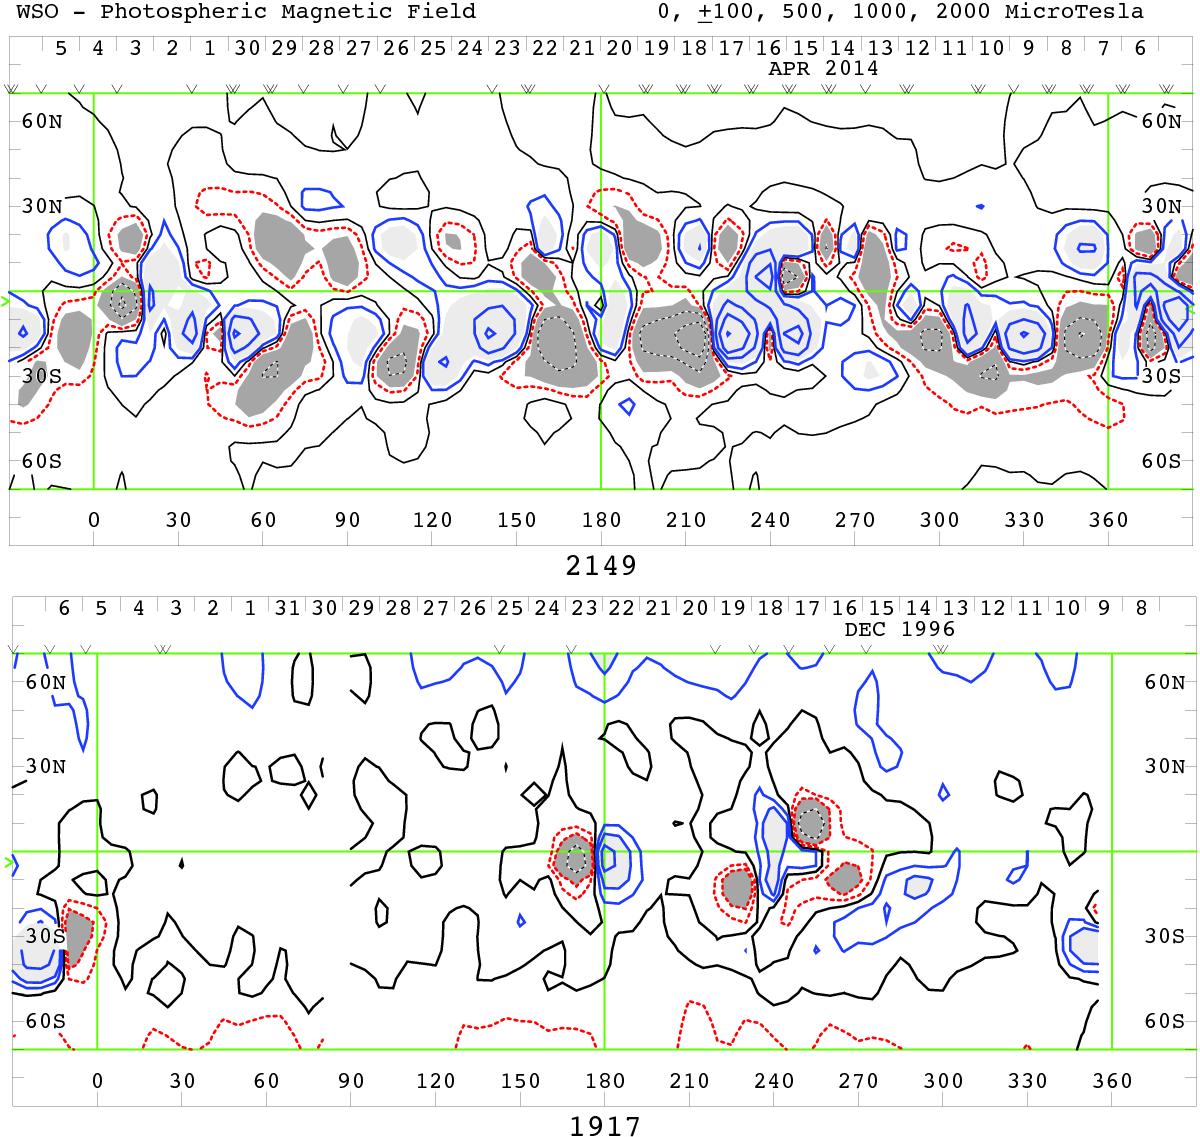
Contour maps show the distribution of magnetic flux over the photosphere during the maximum of solar cycle 24 (top panel) and the minimum of solar cycle 23 (bottom panel). The field above 70°s is not resolved. Blue, light shading shows the positive regions, while red shading indicates negative regions. The neutral line is black. Contours are indicated. Inverted carets show times of contributing magnetograms (taken from the WSO webpage).
Current usage metrics show cumulative count of Article Views (full-text article views including HTML views, PDF and ePub downloads, according to the available data) and Abstracts Views on Vision4Press platform.
Data correspond to usage on the plateform after 2015. The current usage metrics is available 48-96 hours after online publication and is updated daily on week days.
Initial download of the metrics may take a while.