Fig. 8
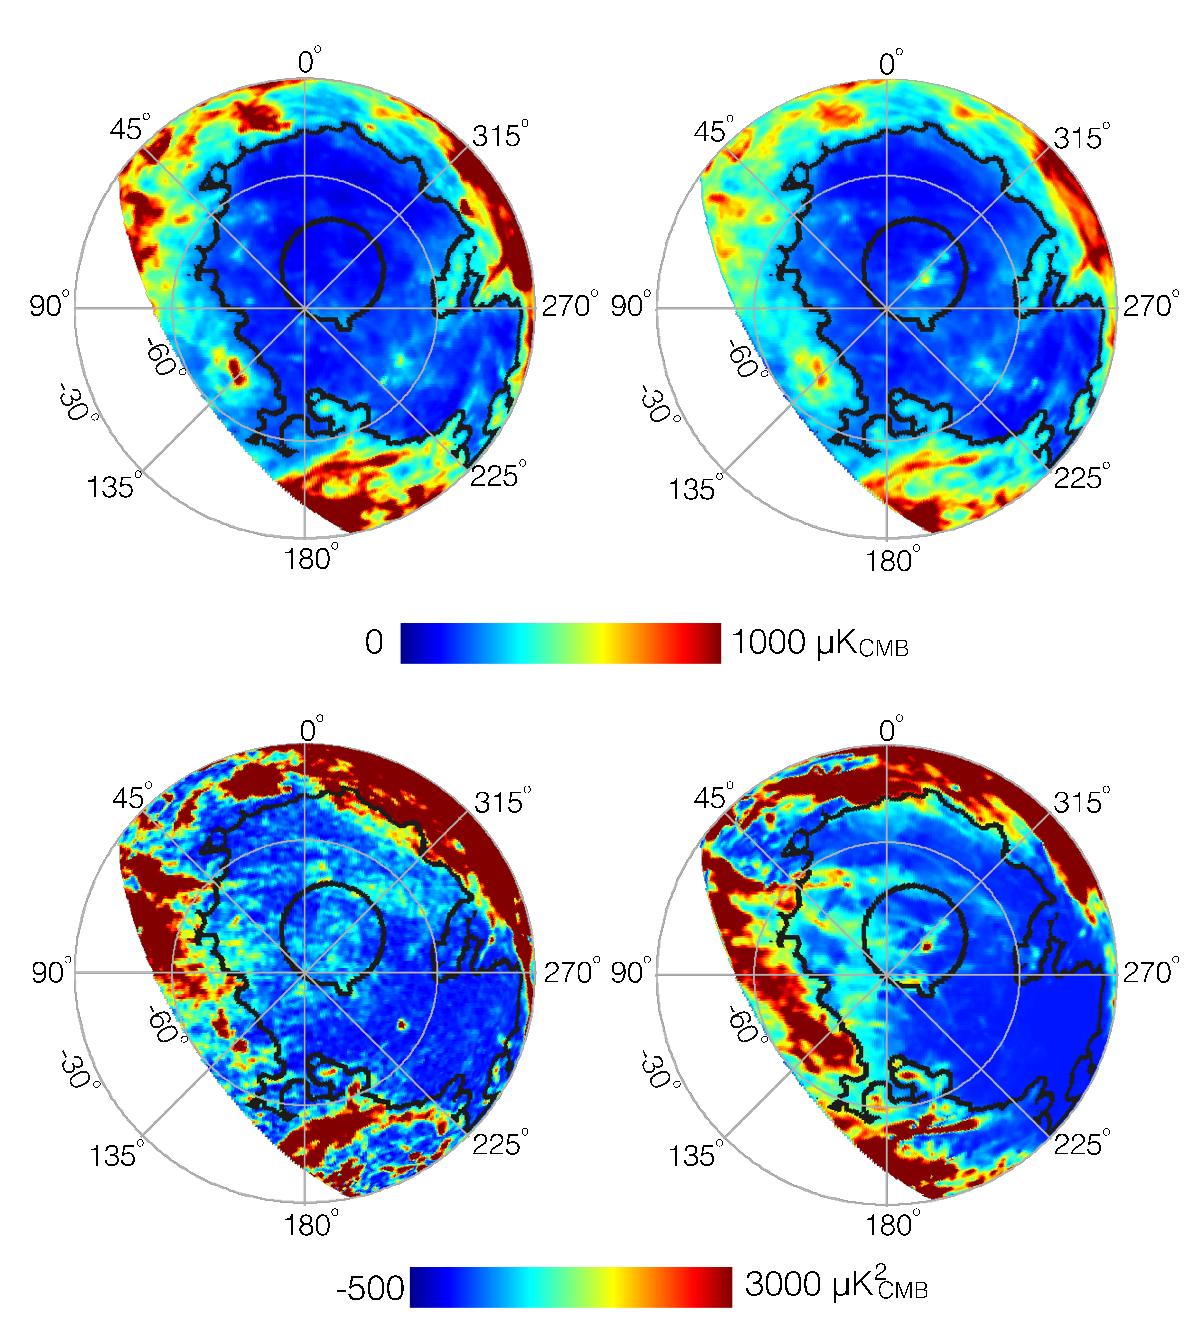
Left column: orthographic projections of the Planck 353GHz D353 (StokesI) map (top row) and the square of the polarization intensity P2 (bottom row), at 1° resolution over the southern Galactic cap covered by the GASS H I survey, with the selected region SGC34 outlined by a black contour. The same coordinate system is used as in Fig.1. Right column: similar to left panels, but for a realization of the 353GHz dust model. Judged visually, the dust model is able to reproduce roughly the observed dust polarization sky over SGC34, and indeed over the entire field shown.
Current usage metrics show cumulative count of Article Views (full-text article views including HTML views, PDF and ePub downloads, according to the available data) and Abstracts Views on Vision4Press platform.
Data correspond to usage on the plateform after 2015. The current usage metrics is available 48-96 hours after online publication and is updated daily on week days.
Initial download of the metrics may take a while.