Fig. 5
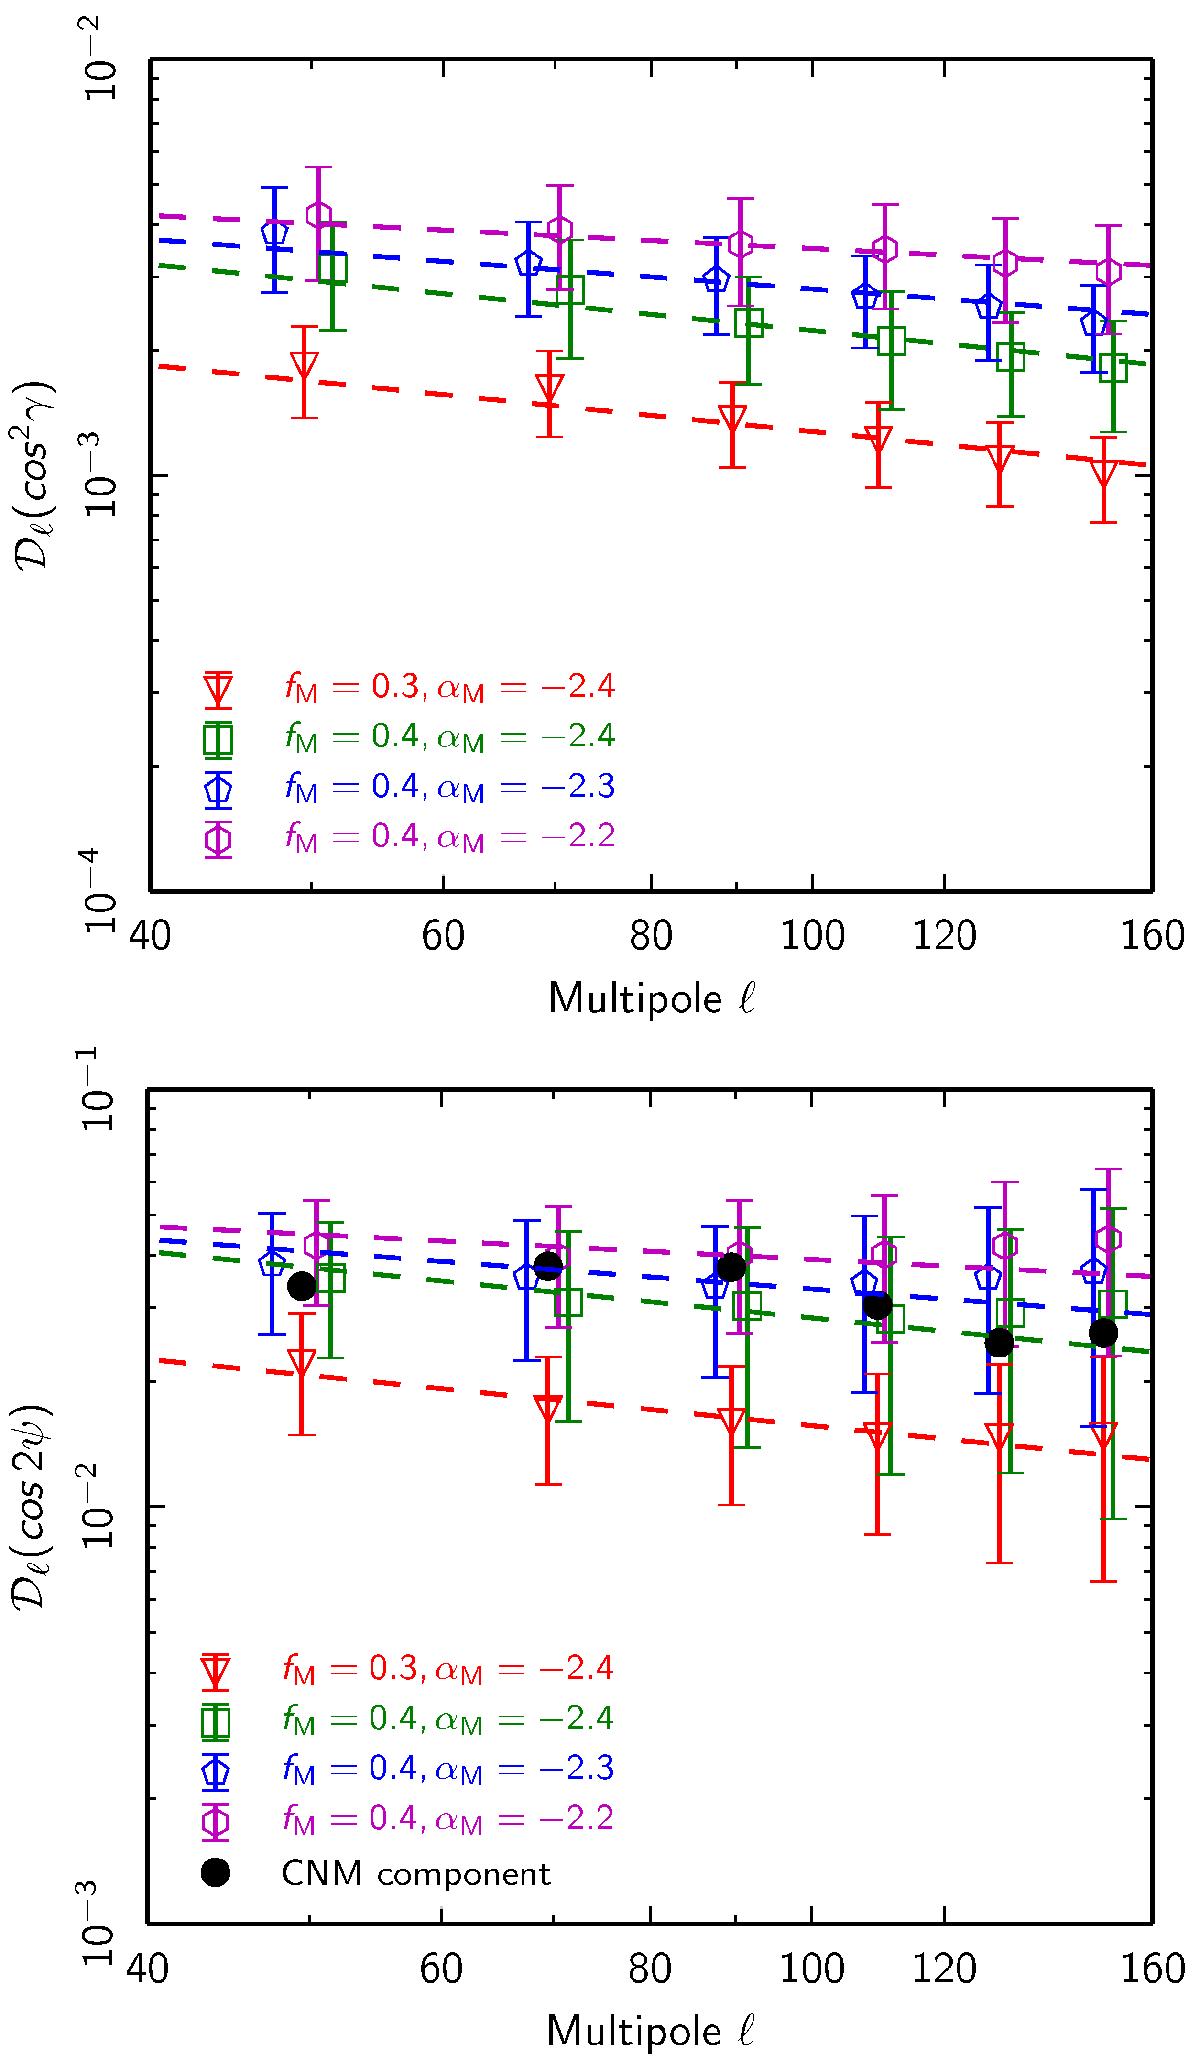
Mean power spectra of cos2γ (top panel) and cos2ψ (bottom panel) over SGC34 for a set of αM and fM parameters in the multipole range 40 <ℓ< 160. The 1σ error bars are computed from the standard deviations of the 100Monte-Carlo realizations of the dust model. The alignment of the CNM structures with BPOS (see Sect.5.1 for details) constrains the value of ![]() and
and ![]() for the CNM component.
for the CNM component.
Current usage metrics show cumulative count of Article Views (full-text article views including HTML views, PDF and ePub downloads, according to the available data) and Abstracts Views on Vision4Press platform.
Data correspond to usage on the plateform after 2015. The current usage metrics is available 48-96 hours after online publication and is updated daily on week days.
Initial download of the metrics may take a while.